What is a trendline? What are the important points to keep in mind while drawing a trendline? The trend line is used to identify trend reliability, support & resistance levels. It is a method to predict what will happen with …

What is a trendline? What are the important points to keep in mind while drawing a trendline? The trend line is used to identify trend reliability, support & resistance levels. It is a method to predict what will happen with …
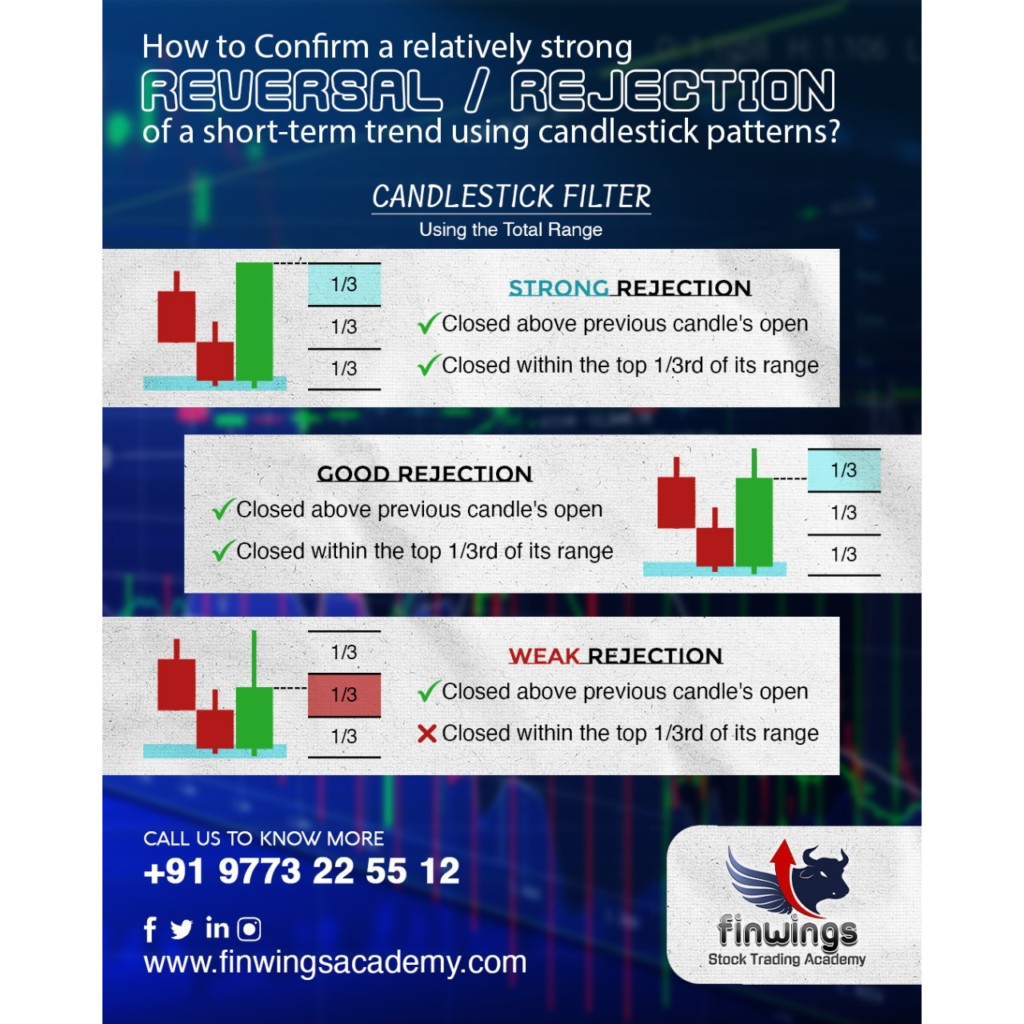
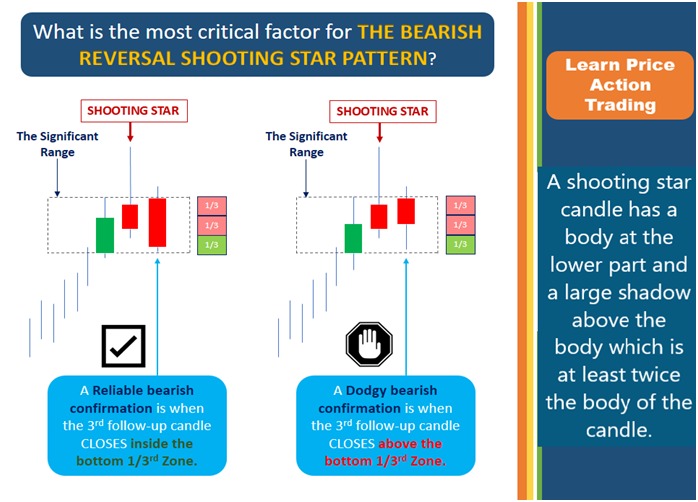
What are the important factors to confirm the reliability of the candlestick chart patterns? I have my way of looking at the candlesticks and analyzing their characteristics, like who dominated (buyers/seller), What is the size of the candle as compared …
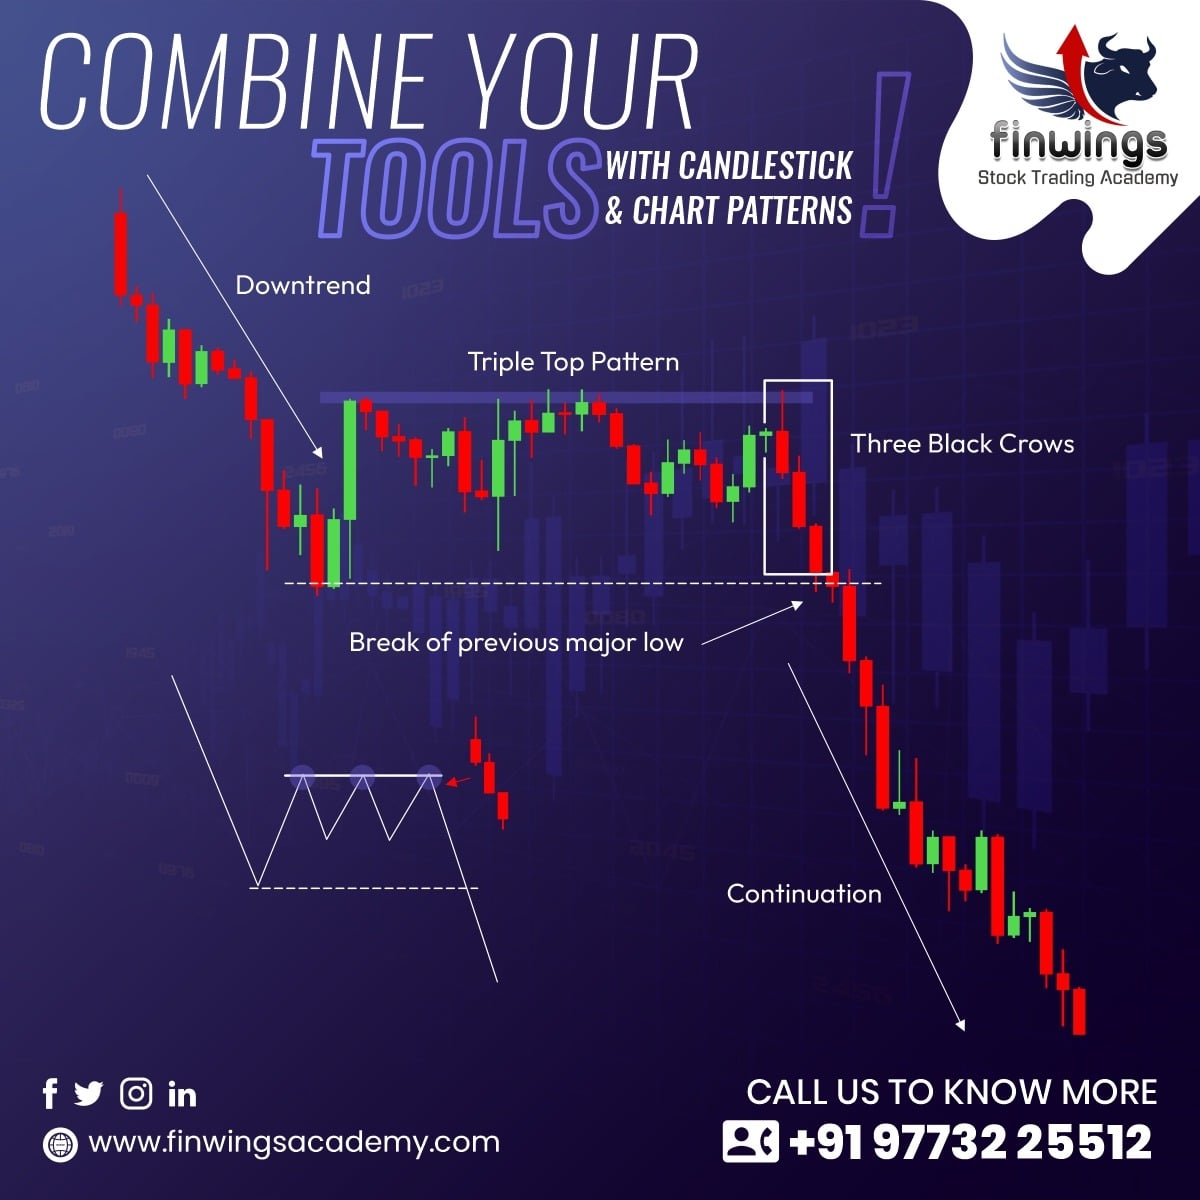
How to enter a trade in the direction of the Dominant or Primary Trend by combining all price action tools? How do you combine candlestick patterns? Two candlestick patterns may be combined to create a third, which clarifies what is …
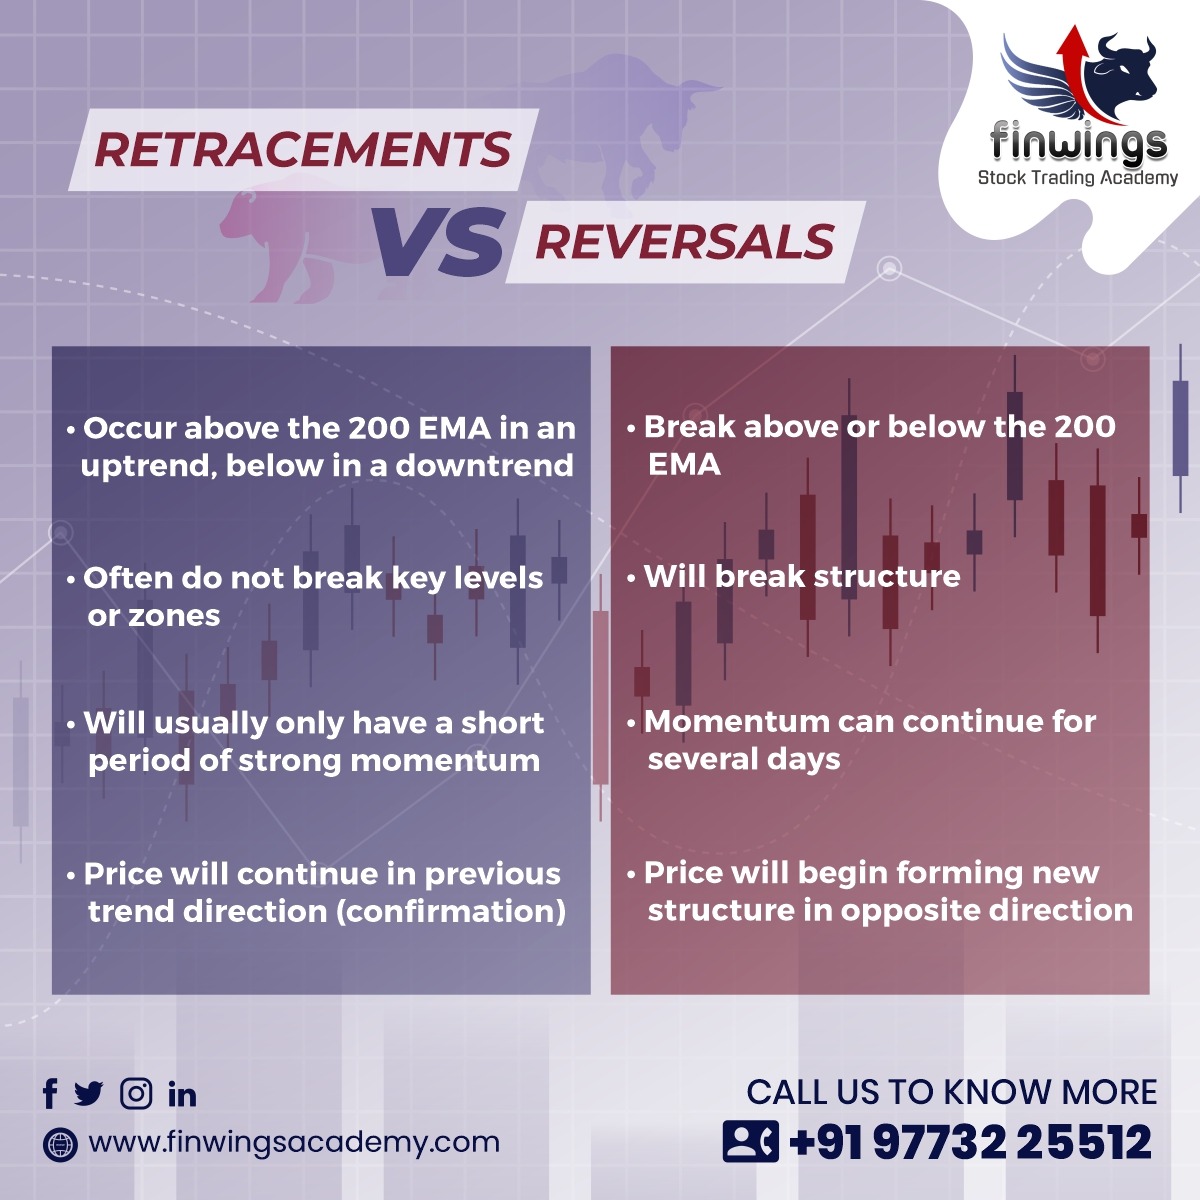
What is the Difference between a Retracement and a Reversal in a trend? A retracement is a technical anology used to analyse a small pullback or change in the direction of a financial asset’s price, such as a stock, commodities, …
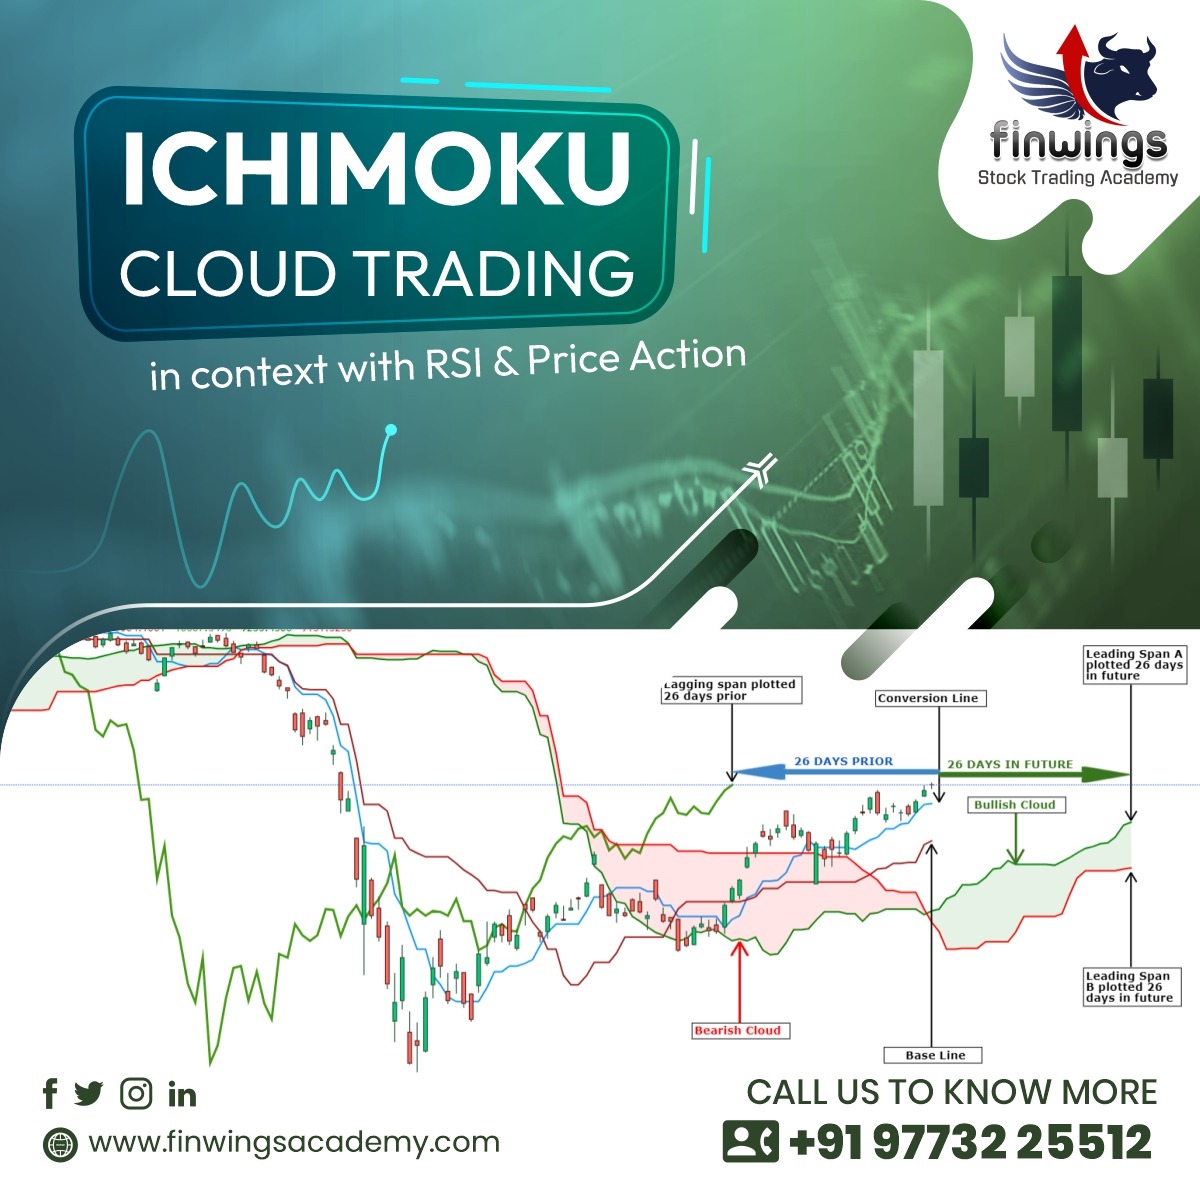
How to Trade with Ichimoku Cloud and its components after you price action trade setup? The Ichimoku Cloud, also known as Ichimoku Kinko Hyo, is a versatile indicator that defines support and resistance, identifies trend direction, gauges momentum and provides …
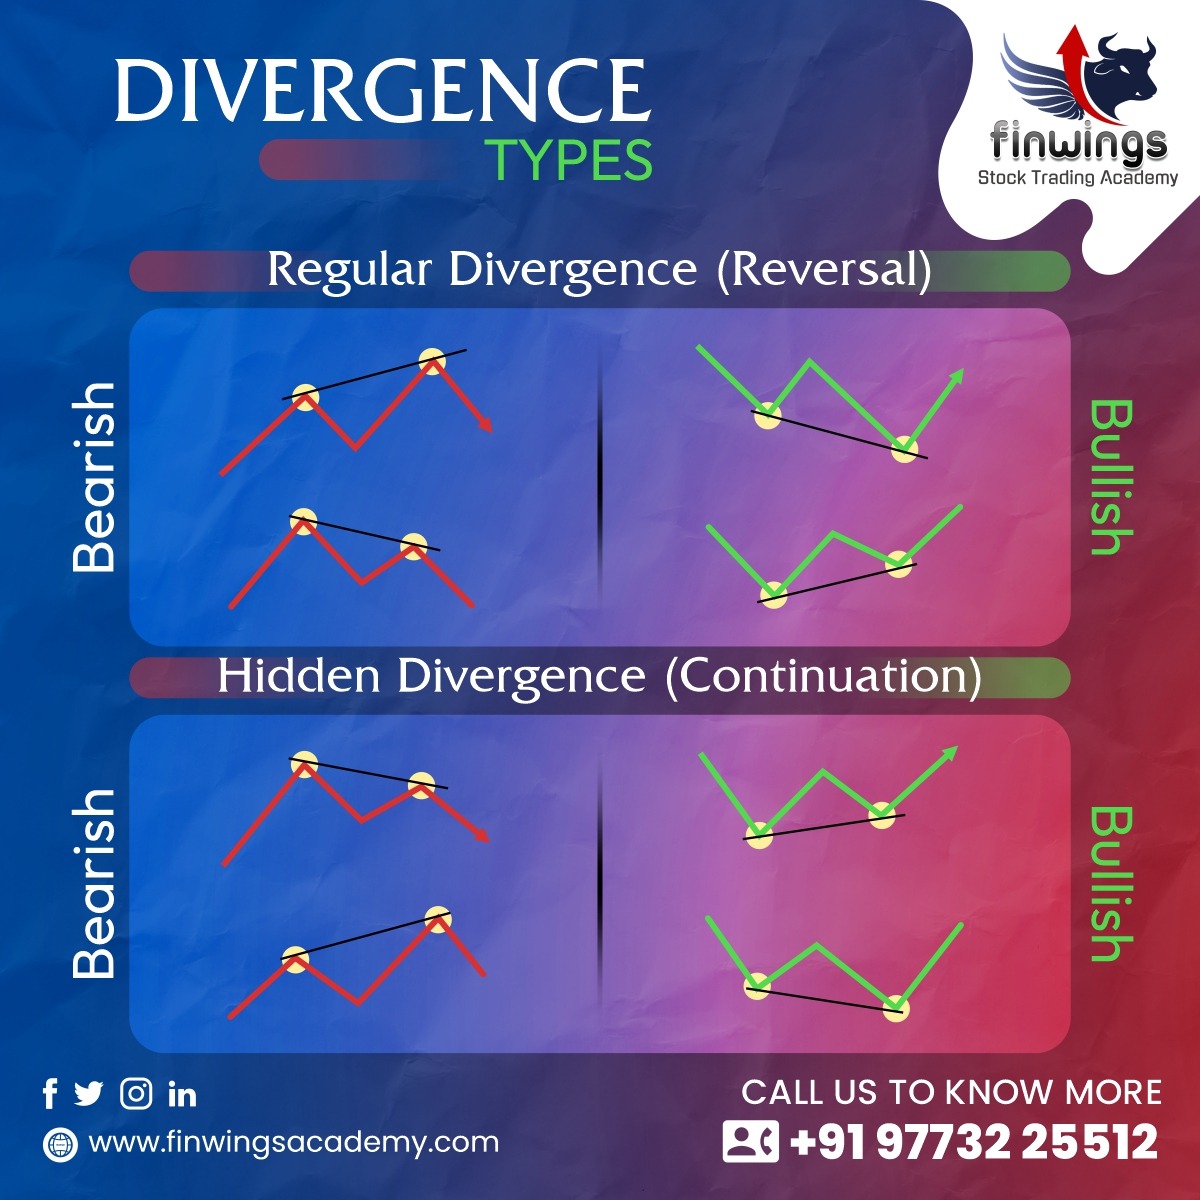
What is Divergence? Divergence is when the price of a security and any technical indicator or oscillator is moving in the opposite direction or is moving contrary to other Statistical data. A Divergence in technical analysis signals that the current …

The Q2 results by the leading bankers were quite to the street’s expectation and so as the Bank index of the Indian Stock Exchange moved significantly higher marking an All-time-high of 41829.60 on 25 Oct 2021. The leading gainers were …

Find a trading style that suits you The best way to find out is, to read Market Wizards, by Jack Schwager or there are many other books to go for. You’ll be exposed to different trading styles by successful traders, …
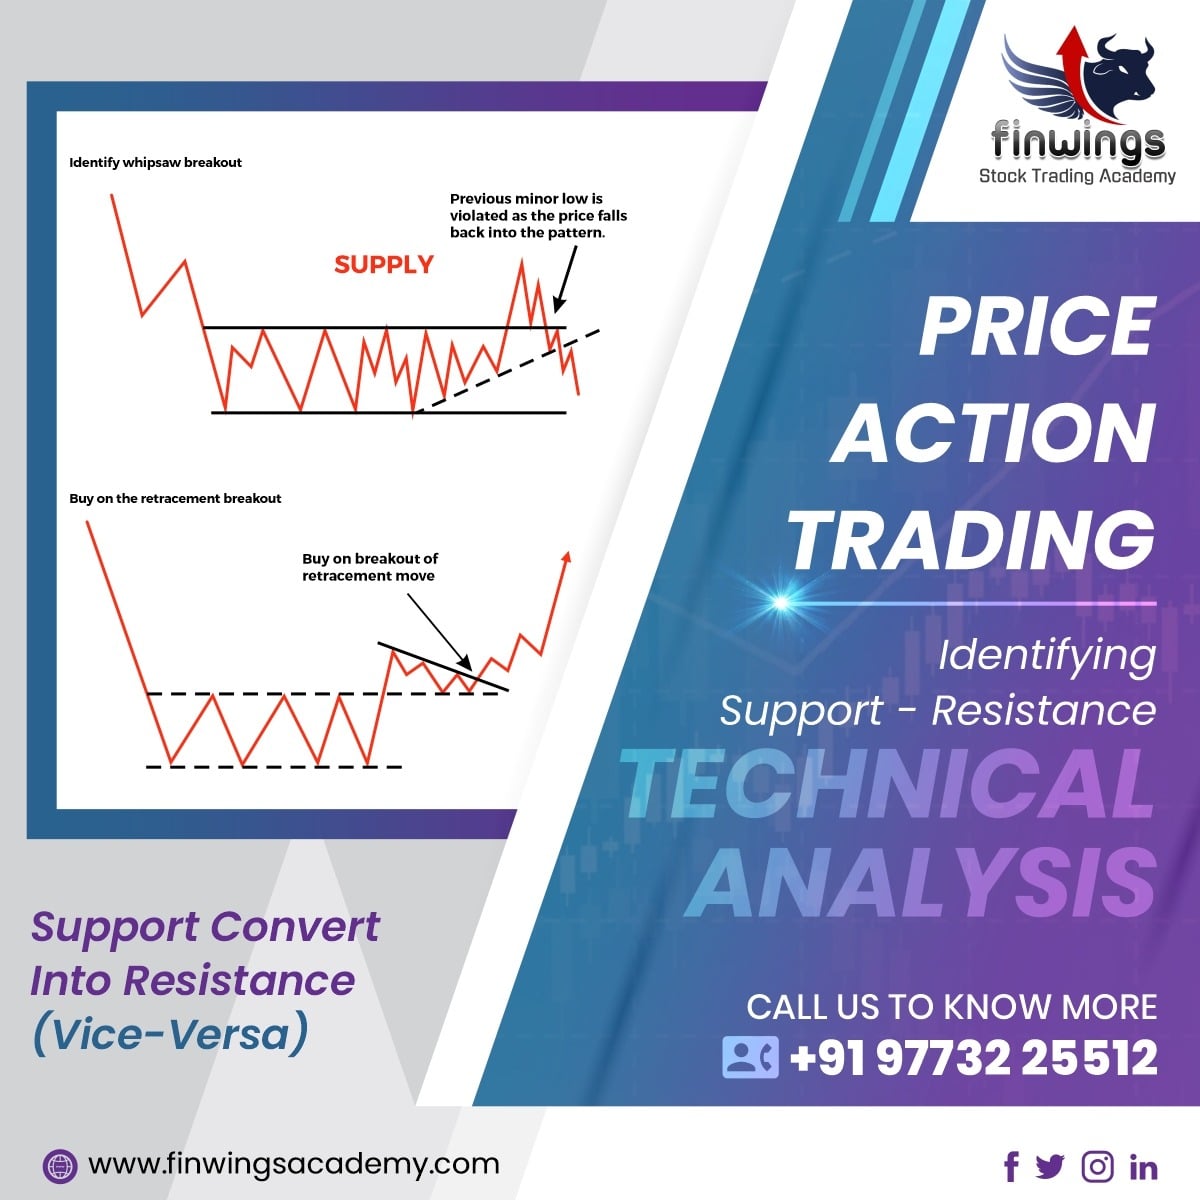
Support and Resistance is one of the most widely used concepts in Technical Analysis. Support and resistance represent key junctures where the forces of supply and demand meet. In the financial markets, prices are driven by excessive supply (down) and …
What are the important points to analyze candlestick patterns correctly? What is the psychology behind the formation of the candlestick patterns? Nowadays, Trading in the stock market with the help of a candlestick chart is very common. But more often …

Live Market Hours Learning

Lifetime membership

12 Years of Experience

70+ In-house Trading Strategies

30+ Options Trading Strategies


4.9 Rated on
Google 247 Reviews