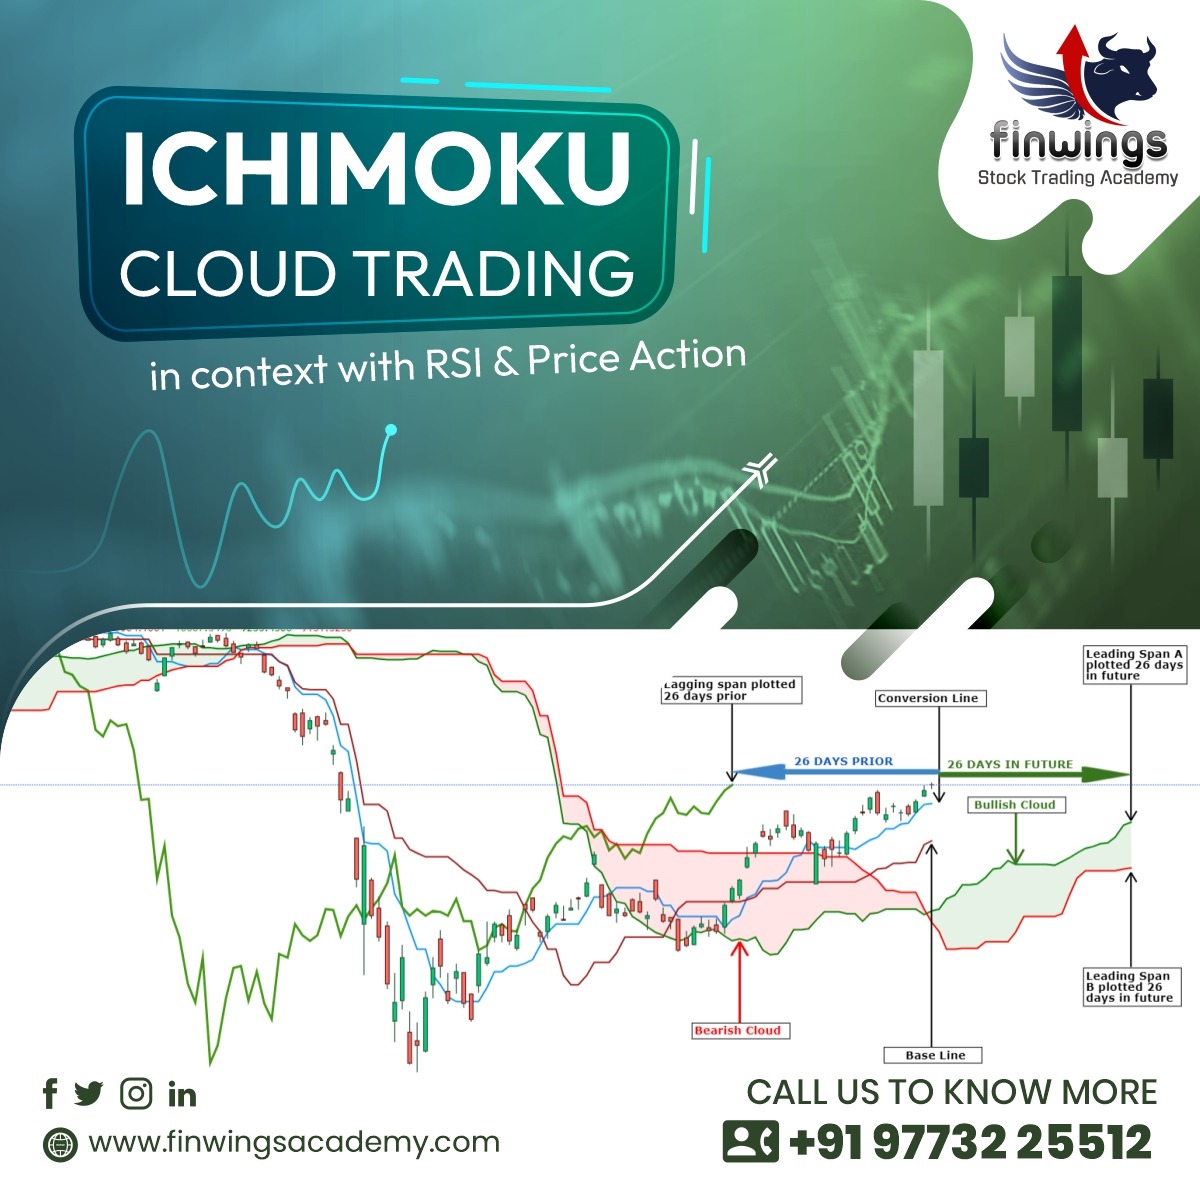
Ichimoku Cloud Trading in context with RSI & Price action
How to Trade with Ichimoku Cloud and its components after you price action trade setup?
The Ichimoku Cloud, also known as Ichimoku Kinko Hyo, is a versatile indicator that defines support and resistance, identifies trend direction, gauges momentum and provides trading signals.
Ichimoku Kinko Hyo translates into “one look equilibrium chart”. With one look, chartists can identify the trend and look for potential signals within that trend.
Even though the Ichimoku Cloud may seem complicated when viewed on the price chart, it is really a straightforward indicator that is very usable.
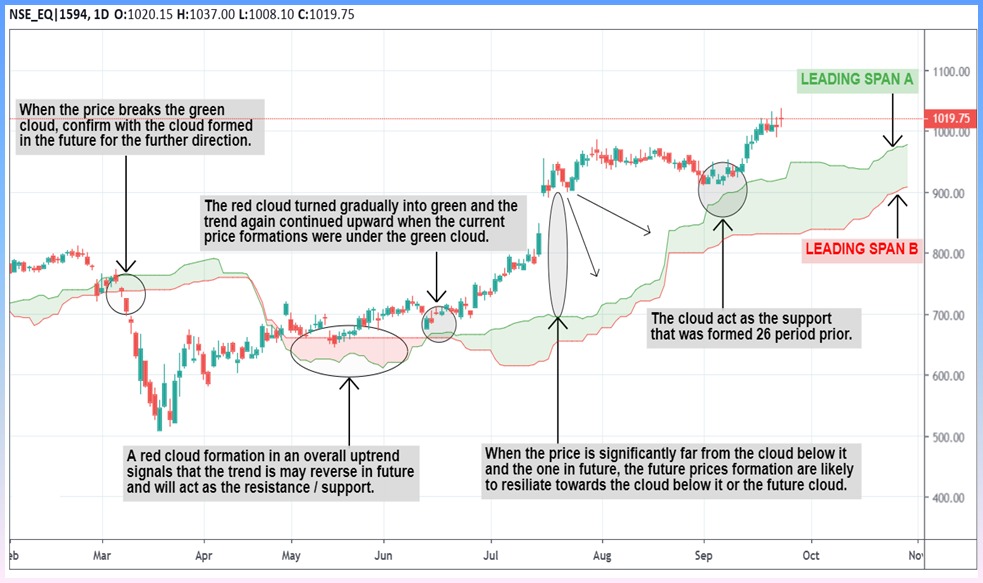
The cloud
- The Cloud (Kumo) is the most prominent feature of the Ichimoku Cloud plots. The Leading Span A (green) and Leading Span B (red) form the Cloud.
- The Leading Span A is the average of the Conversion Line and the Base Line. Because the Conversion Line and Base Line are calculated with 9 and 26 periods, respectively, the green Cloud boundary moves faster than the red Cloud boundary, which is the average of the 52-day high and the 52-day low. It is the same principle with moving averages.
- The leading span A & B are plotted 26 period in future to the current price.
- It is because the creator believes that the current price averages will have an impact in future where the cloud is displaced as any formation of a trend depends on the prior price actions.
Conversion Line & Base lines
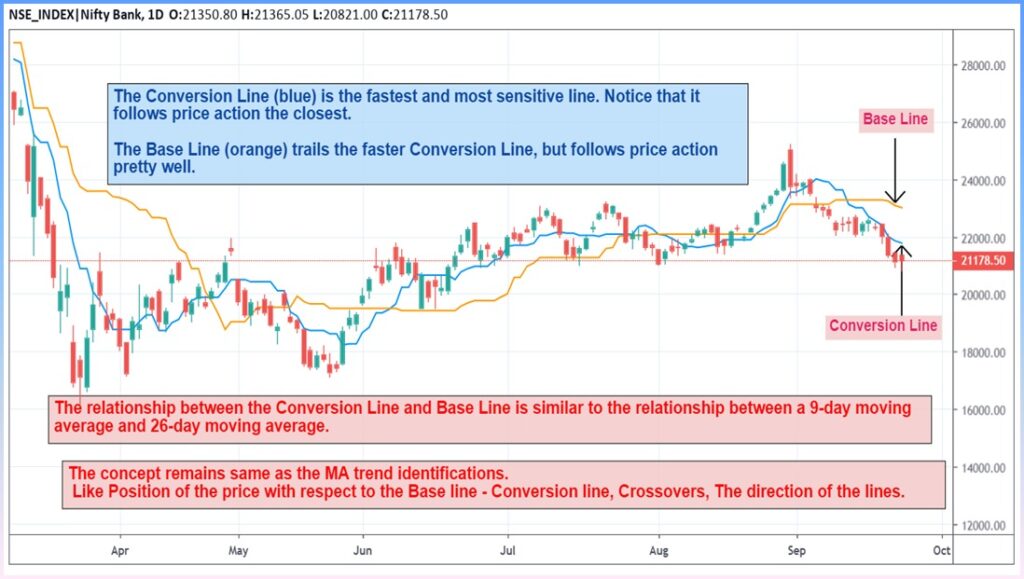
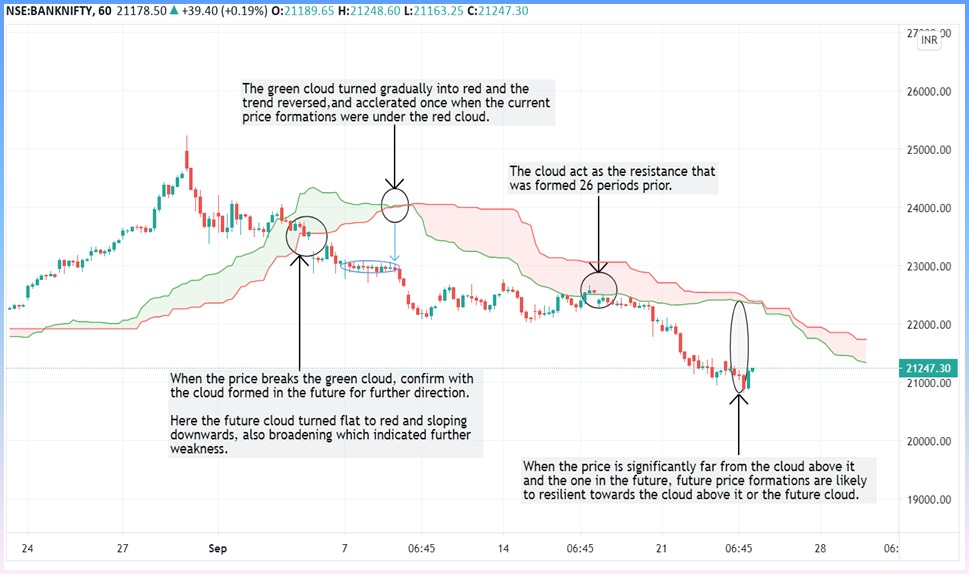
- Price, the Conversion Line and the Base Line are used to identify faster, and more frequent, signals. The location of both lines above or below the corresponding cloud (red or green) gives a better signal to trade in the direction and colour of the cloud.
- It is important to remember that bullish signals are reinforced when prices are above the cloud and the cloud is green. Bearish signals are reinforced when prices are below the cloud and the cloud is red.
- In other words, bullish signals are preferred when the bigger trend is up (prices above green cloud), while bearish signals are preferred when the bigger trend is down (prices are below red cloud).
- This is the essence of trading in the direction of the bigger trend.
- Signals that are counter to the existing trend are deemed weaker. Short-term bullish signals within a long-term downtrend and short-term bearish signals within a long-term uptrend are less robust.
The Lagging Span
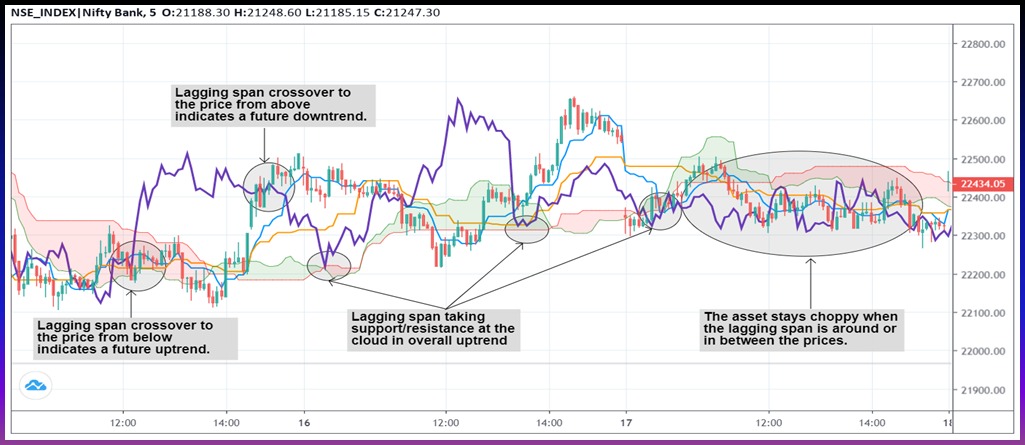
- Lagging span is designed to allow traders to visualize the relationship between current and prior trends.
- A Lagging span that is currently trading above where prices were 26 periods ago, indicates a present uptrend for the asset. Current trading below past price trends indicates a downtrend.
- If it appears that the lagging span line is about to cross above the prior price line, it would be a bullish confirmation sign, while a span that is crossing underneath would be a bearish confirmation sign.
- Trading signals based on the lagging span are strongest when it does not touch or cross over any the prior candles. Any interaction with the past price line is an indication of a choppy or sideways market.
- The lagging span also takes the support/resistance of the cloud plotted correspondingly in past.

