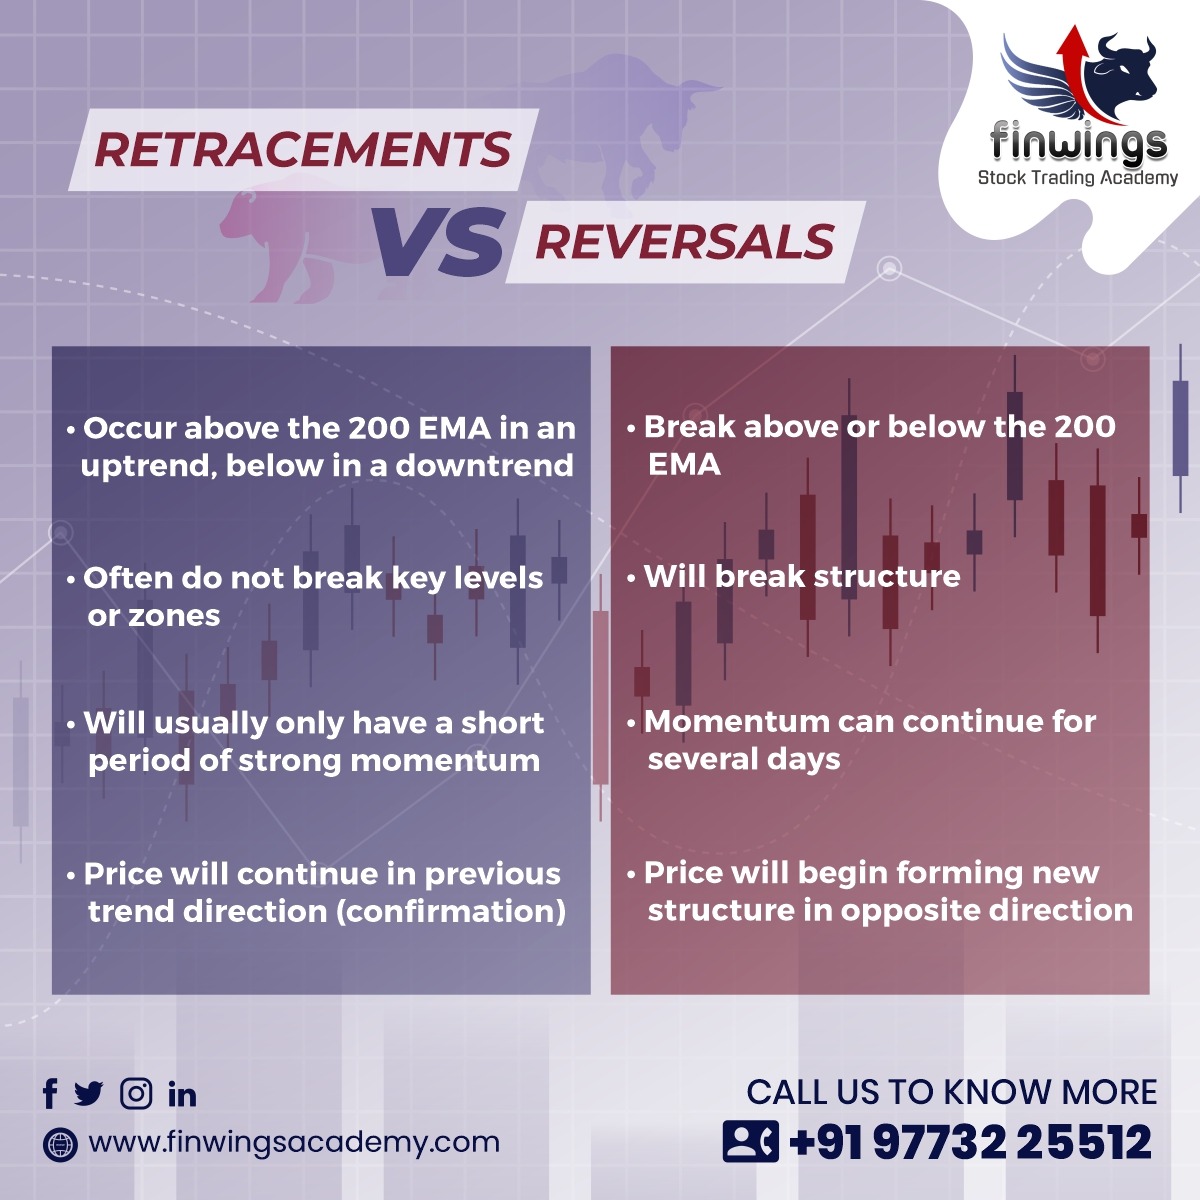
Difference between Retracements vs Reversal taking in the context with 200EMA
What is the Difference between a Retracement and a Reversal in a trend?
- A retracement is a technical anology used to analyse a small pullback or change in the direction of a financial asset’s price, such as a stock, commodities, currency or index. Retracements are temporary in nature and don’t indicate a shift in the primary trend of the asset.
- They usually are opposite in direction and smaller as compared to their prior wave that is in the direction of the major or dominant trend.
- The retracements do not last long and are often exhausted at Fibonacci’s retracement levels of 38.1% or 50%.
- Combined with its crucial demand/supply (Trendline) levels and confirmed with technical indicators it gives a clear idea of whether it is a retracement or a reversal.
- Most of the healthy retracements never breach their primary trend. If the retracement extends below its critical support or resistance then it might indicate a trend reversal signal on change in the market structure. (HH-HL or LH-LL)
- A reversal indicates a complete change in the direction of the prior trend. Reversals are followed when an asset’s price fails to hold its crucial retracement’s support or resistance levels and extends the retracement and turns into a reversal.
- On confirming the reversals the traders try to exit their positions aligned in the direction of the trend prior to the reversal.
- Reversals are typically a larger price change in the opposite direction of the prior dominant trend.
- It is difficult to tell whether it is a retracement or a reversal when it starts to occur. We will have to wait for the confirmations taken in context with other technical tools and indicators to identify it as a retracement or a reversal.


