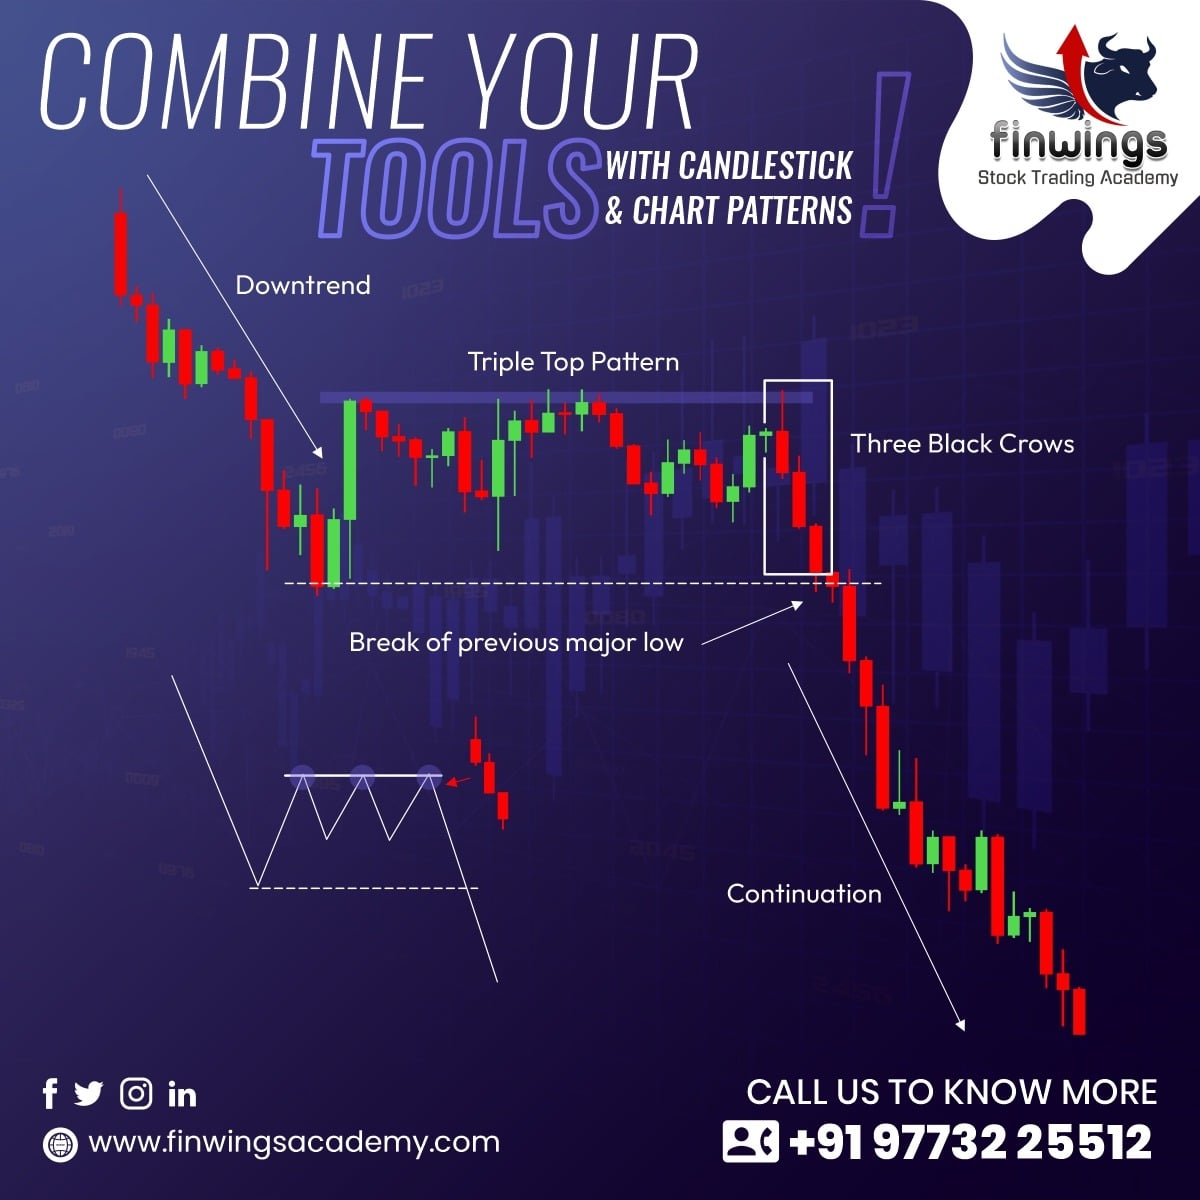
Combine your tools with Candlestick patterns and Chart patterns
How to enter a trade in the direction of the Dominant or Primary Trend by combining all price action tools?
- Identify the primary trend’s direction – Here the primary trend is down
- Wait for a retracement or consolidation within the current trend, look for chart patterns – Here in the above image, after continuing prior downtrend Triple Top Chart pattern is formed, which indicates an indecisiveness in the trend or a pause in the trend. A triple top chart pattern is s bearish reversal chart pattern.
- On breakout of the chart pattern, Confirm the chart pattern’s neckline break with a bearish reversal or continuation candlestick pattern. – Here a three-black crow, bearish reversal candlestick pattern is formed that confirms the selling pressure to continue in confluence with the breakdown of the triple top chart pattern.
- Now Combining all the above analogies we get to know the conviction of the trade is on the sell-side and should initiate the trade accordingly with position sizing.
- Confirm this price action trading setup with your indicators, for e.g using RSI, Moving averages and OBV in confluence will give you how long the trend may continue and so as you can et your targets.
- Targets and stop loss for any trading setup can be set according to Fibonacci extension levels, ATR, Market structure-based (HH-HL, LH_LL), percentage-based, Chart Patterns based targets, prior swing Highs or Lows, and trendlines in case the asset is trading at new highs or lows.
How do you combine candlestick patterns?
Two candlestick patterns may be combined to create a third, which clarifies what is happening in the markets. A shooting star or a bullish pin bar will appear in the 2-hour timeframe, for instance, if you take the two 1-hour candles (bullish engulfing) and combine them.
Which is better, chart pattern or candlestick pattern?
A candlestick pattern is created by accumulating one or more candlesticks.
A chart pattern results from the price movement of a financial instrument (stock, derivative, etc.) over time as a result of psychological and fundamental factors. None of the two is superior or inferior and totally depends on the trading style of the trader as what suits him the best.
Are chart patterns the same as candlestick patterns?
Chart patterns are created when the price fluctuates over time as a result of psychological and fundamental factors. whereas Candlestick patterns only show for a short span of time.
Do professional traders use candlestick patterns?
Yes, candlestick analysis may be successful provided you stick to the rules and wait for confirmation, which typically comes in the candle of the following day. Candlestick analysis is a popular tool used by traders all over the world, especially those based outside Asia, to identify the general market trend rather than the direction in which prices will be in two to four hours. Daily candles operate better than temporary candlesticks because of this.
Which is the strongest candlestick pattern?
There are many strong candlestick patterns like Doji, Dragonfly doji, Gravestone doji, Spinning top, Hammer etc and again it depends upon the trader how he uses those patterns to generate profit on that particular trading day. Traders practise all of these candlestick patterns but select one which suits their trading style.


