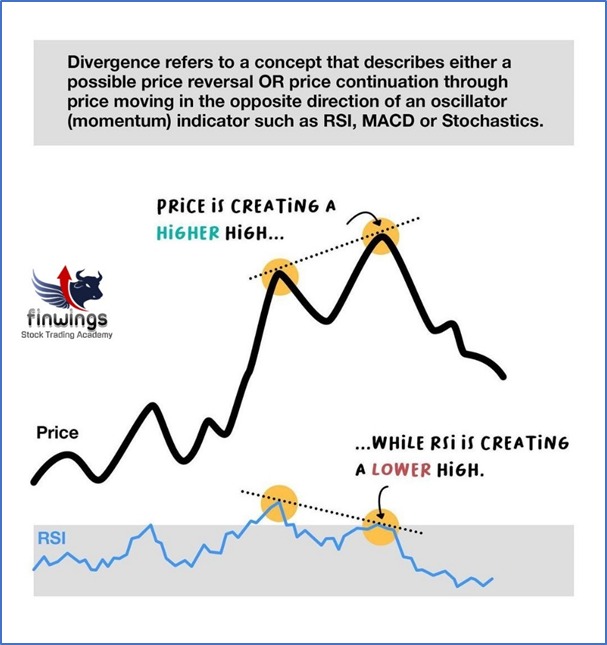
Types of Divergence
What is Divergence?
Divergence is when the price of a security and any technical indicator or oscillator is moving in the opposite direction or is moving contrary to other Statistical data.
A Divergence in technical analysis signals that the current price trend may be weakening, and in some cases may lead to the price reversal on confirmation of the over-all trend analysis.

There are 2 types of Divergence
- Positive divergence
- Negative Divergence
Positive divergence signals a possible higher move in the price of the asset or the current downtrend might be weakening and Negative divergence signals a possible lower move in the price of the asset or the current uptrend weakening.
Traders use divergence to analyze and confirm the underlying momentum in the price of an asset, and for assessing the likely move ahead of the asset. For example, investors/traders can plot oscillators, like the RSI, Stochastics, MFI, etc. to look for the divergence.
The Difference Between Divergence and Confirmation
Divergence is the relation between the price of the asset and the indicator plotted that is telling the trader different things.
Confirmation is when the indicator, or multiple indicators and the price action theory like Candlestick patterns, support/resistance breakout, and volume all together are telling the same thing. This helps the trader to enter trades perfectly with confidence. If the price is moving up, the traders need confirmation that will indicate bullish signals.
What is divergence and examples?
Divergence occurs when an asset’s price moves in the opposite direction from other data or from a technical indicator, such as an oscillator. Divergence signals that the price trend may be fading and, in extreme situations, may even result in a price reversal. Divergence may be both beneficial and bad. Positive divergence suggests that the asset’s price may rise in the future. A move lower in the asset is indicated by negative divergence.
What are the three types of divergence?
Divergences can be classified as bullish (positive), bearish (negative), or hidden. When the price makes lower lows while the indicator makes higher lows, this is referred to as a bullish divergence and suggests that the downtrend may soon turn or at least decelerate to a sideways, range-bound pattern.
When the price is hitting higher highs during an uptrend but the indicator is hitting lower highs, this is known as a bearish divergence. The price is expected to become negative and start declining, or at the very least, to go sideways, according to this divergence.
Similar to conventional divergences, hidden divergences also have lower highs and higher lows, but they appear on the price chart rather than the indicator. Divergences in the shadows suggest that the price trend is going to continue.
How many types of divergence are there in RSI?
There are two types of divergences, Regular divergence and Hidden divergence. Regular divergences signal a possible trend reversal while Hidden divergences signal a possible trend continuation.


