Where will BANKNIFTY maneuver after correcting 15% from its All-Time-High?
The Q2 results by the leading bankers were quite to the street’s expectation and so as the Bank index of the Indian Stock Exchange moved significantly higher marking an All-time-high of 41829.60 on 25 Oct 2021. The leading gainers were Kotak Bank and ICICI bank which led the rally.
But since the ATH Bank Nifty is correcting significantly and tested the crucial correction mark of 15%. The main factors that enforced the profit booking in the index were overvaluation of the stock prices, FIIs slowing their participation and the scare of the 3rd wave of Covid recently intensified the downtrend.
In any Bull run the major indices tend to correct 10-15% at euphoria no matter what is going on globally or any event occurrences.
So, what now, where will the market head?
Is the correction over? Can we BUY the Dip?
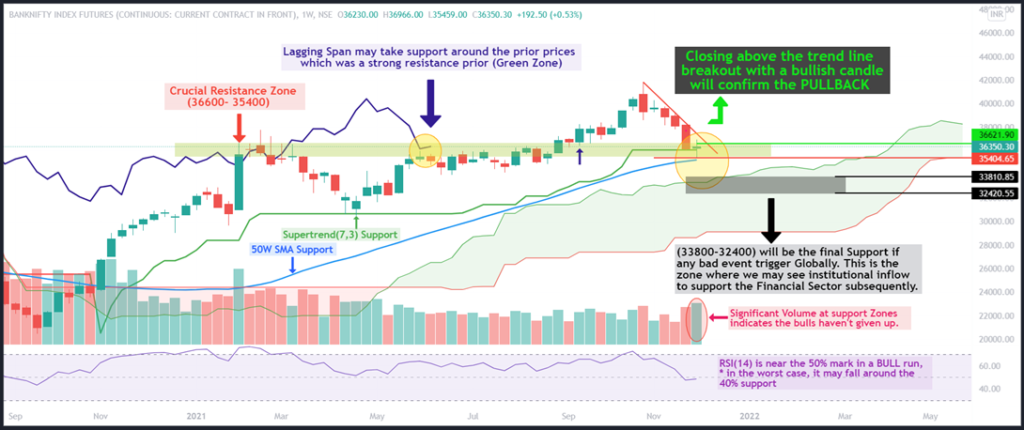
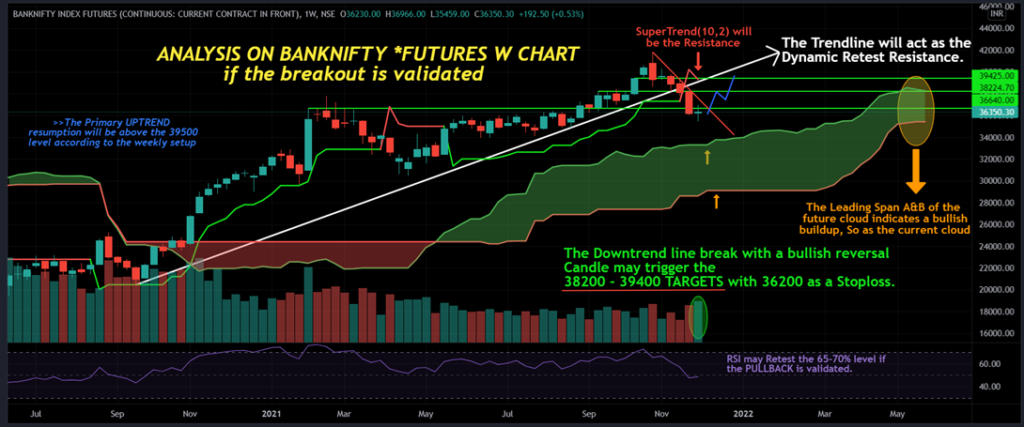
Analyzing the WEEKLY chart of Bank Nifty Futures, we have some important highlights discussed below.

- If we look at the past 10-month performance of overall banking stocks we can see the net return is almost Nil. On 1st Feb 2021 Bank Nifty index marked an ATH of 36615.20 amid the Central financial budget21.
- Since then, the 36600- 35400 Resistance zone was hard to breach by the bulls. The recent breakout in September rallied the index to another ATH of 41829.60.
- Currently the index has corrected to the prior breakout levels and is sustaining above it. The recent weekly candle indicates an indecisiveness in the short term sellers as a “Doji” candle has formed with significant volume which also shows some steam left for the current Bull run.
- If the bulls try to dominate and a healthy bullish candle is formed in the weekly chart in coming week or two, we can confirm the pullback towards the 38200 – 39400 levels.

- The current Primary trend will resume above the 39500 mark on weekly closing basis as it will breach the 0.612 Fibonacci retracement level of the current downfall from the ATH.
- The short-term resistance is around the 36600-36800 zone, a decisive close above these levels will fuel the short covering and led the index even higher.
- If the bulls fail to dominate, the final support for the current bull run in Bank Nifty is around the 33800-32400 where we may see an institutional inflow amid the upcoming budget to be in favour of the investors to revive the economy.
- Overall, most of the technical indicators (as discussed in the above charts) I take into context shows the current level to be a good support and is more likely that Bank Nifty may not fall further and move towards the upper levels to retest the prior demand zones.
- The downside from the current levels will only be triggered if the Omicorn Variant tends to be deadlier than the expert’s expectations. Short term volatility to continue till then.
How do you predict the Bank Nifty movement?One of the major indexes, Bank Nifty, includes the biggest and most liquid Indian banking equities. We can determine the strength or weakness of the current trend in Nifty by observing the lagging and leading behaviour of Bank Nifty. In fact, the Bank Nifty Index has a favourable impact on nearly all of the NSE sectoral indices throughout both bull and bear market phases. Therefore, the investing and trading community must consider the behaviour of the banking sector stocks as they impact the behaviour of other sector stocks as well and make trade investments in accordance.
What is the all time high of Bank Nifty?
44,020.90 is the all time high of Bank Nifty
Which time frame is best for Bank Nifty?
Depending on the method of trading, traders can adopt any time frame from 1 minute to 5 minutes and 15 minutes. Time frame depends totally on the trading method of a trader.
Can Bank Nifty become zero?
Theoretically Bank Nifty can never become Zero, because there is always some time decay value available, and also no exchange would ever execute a trade at zero price.
How do you know if Bank Nifty is bullish or bearish?
There are various ways to predict the bullishness or bearishness of Bank Nifty such as price action, indicators, events etc. There are various indicators like RSI, MACD and Moving Averages which can tell a trader whether Bank Nifty is Bullish or Bearish for that particular day.


