Learn Stock Market Trading- Technical Analysis aspects in the Right Way. What is a Candlestick Chart and the Patterns? A Japanese Candlestick chart is the right way of presenting the price action over a specific time period. The Candlestick chart …
Learn Stock Market Trading- Technical Analysis aspects in the Right Way. What is a Candlestick Chart and the Patterns? A Japanese Candlestick chart is the right way of presenting the price action over a specific time period. The Candlestick chart …
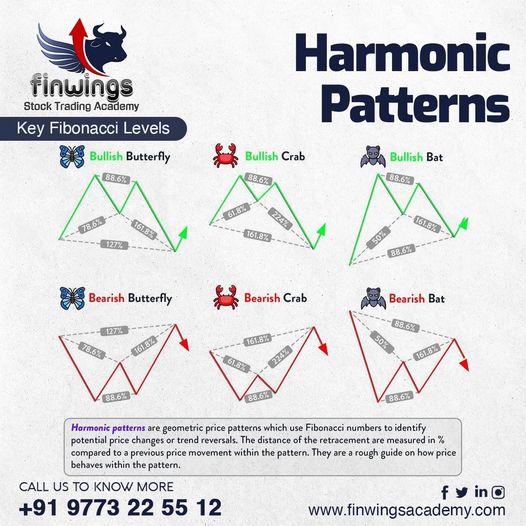
Know the KEY Fibonacci levels that should be kept in mind while validating the pattern. Since the introduction of harmonic patterns in Harold M. Gartley’s 1935 book, Profits in the Stock Market, a lot has changed. So it’s inevitable that …
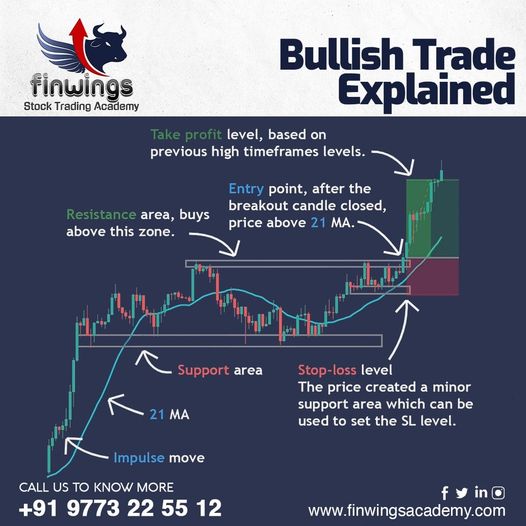
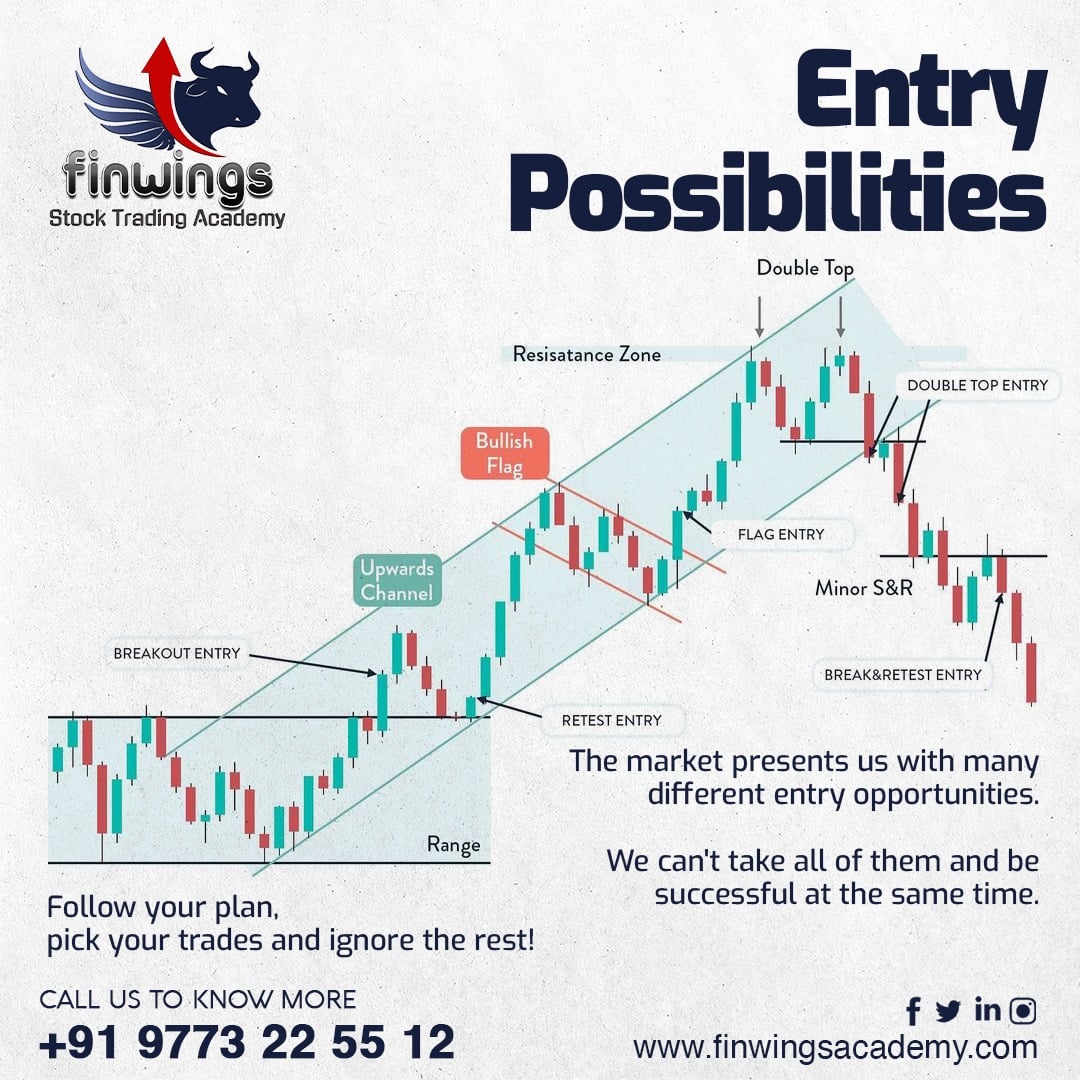
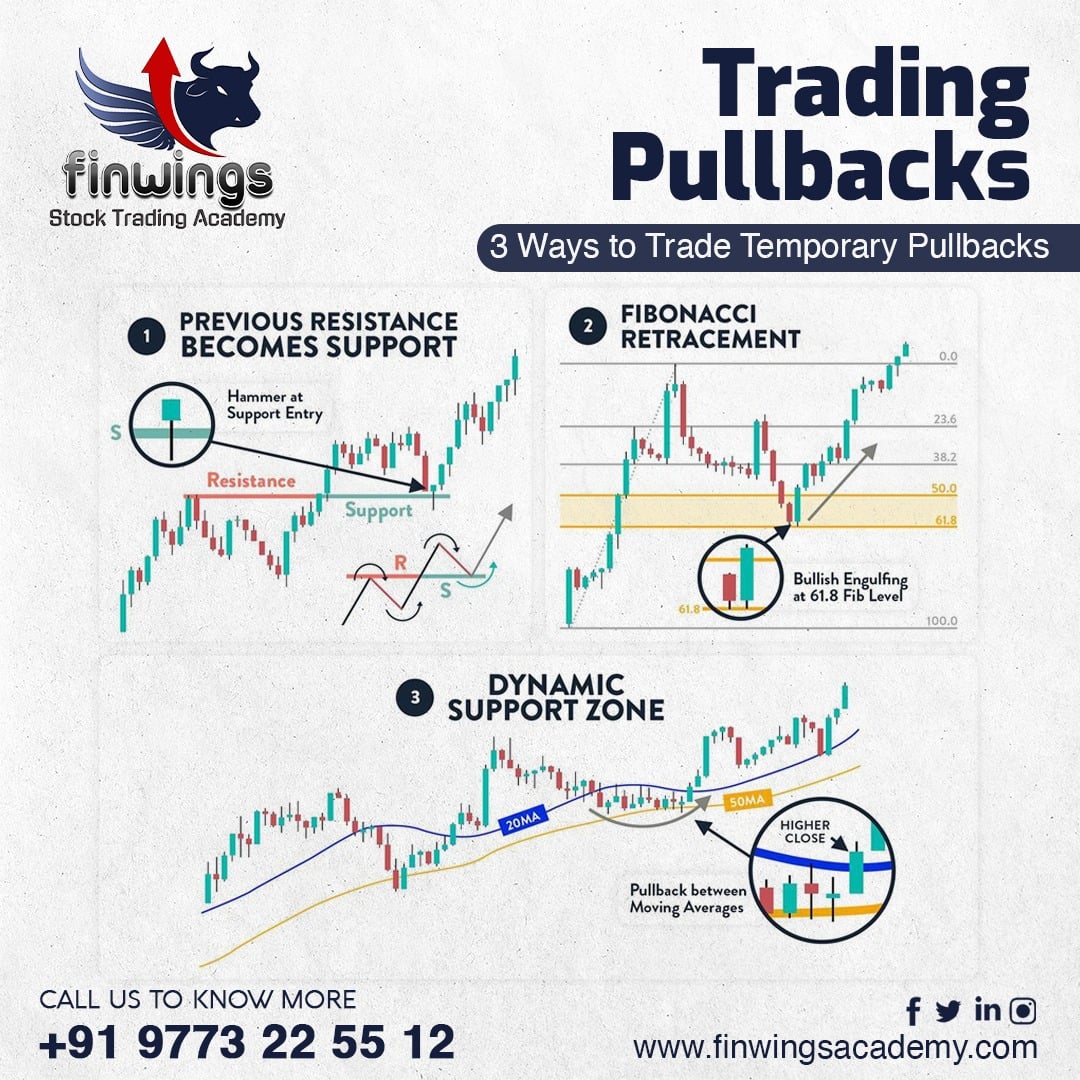
Use Support/Resistance zones with Moving Average(21). Learn Price Action TRADING with Moving Average(21). Know your Entry-EXIT-Stoploss. Why Finwings Stock Trading Academy: Dedicated Team of Experts for different studies and research. We provide complete support for the enhancement of the candidates. …
𝐀𝐛𝐨𝐮𝐭 𝐭𝐡𝐞 𝐜𝐨𝐮𝐫𝐬𝐞: Technical Analysis is a method used to predict future prices on the basis of historical price, volume, and open interest. Technical Analysis can help investors anticipate what is likely to happen in the coming days, weeks, or …
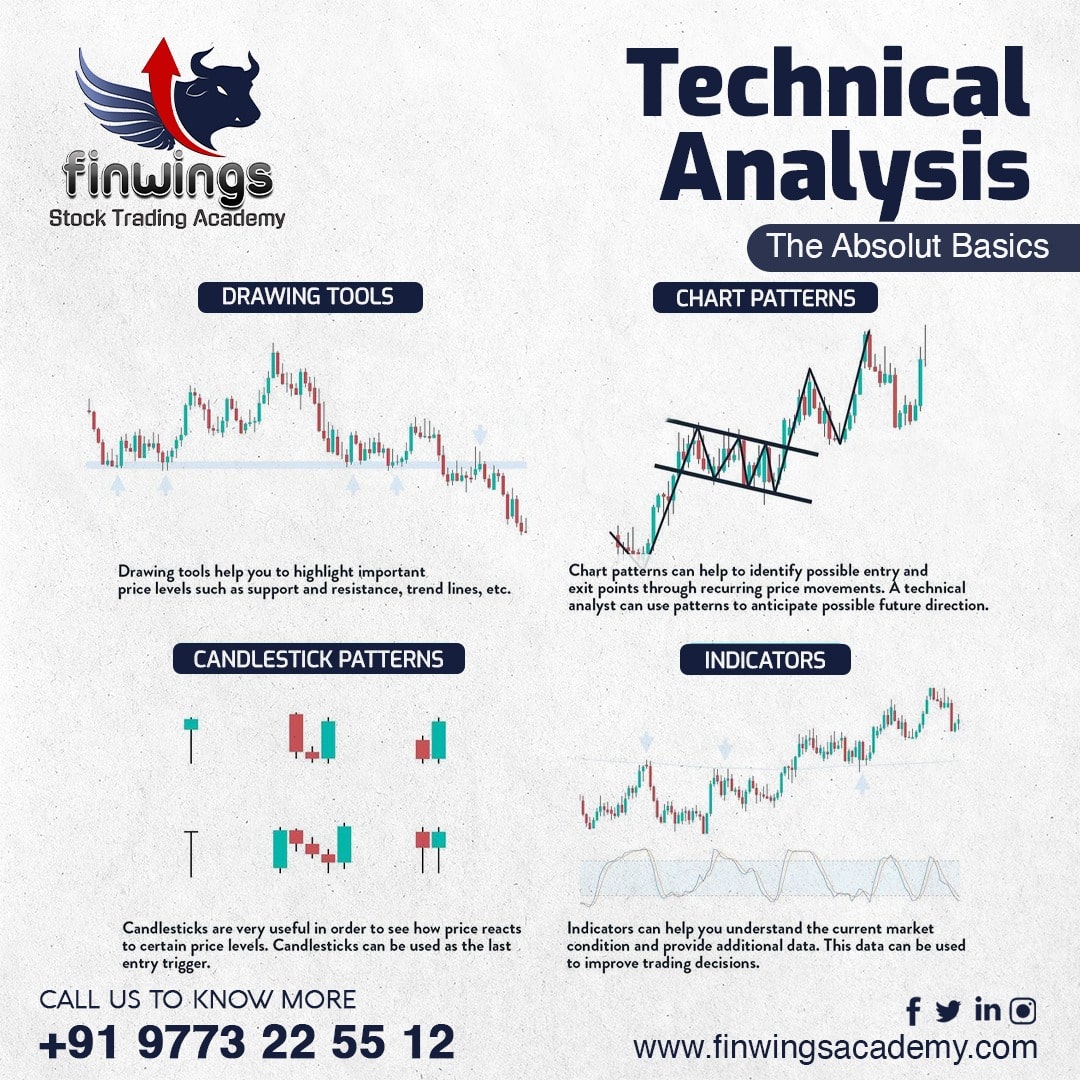
𝐀𝐛𝐨𝐮𝐭 𝐭𝐡𝐞 𝐜𝐨𝐮𝐫𝐬𝐞: Technical Analysis is a method used to predict future prices on the basis of historical price, volume, and open interest. Technical Analysis can help investors anticipate what is likely to happen in the coming days, weeks, or …
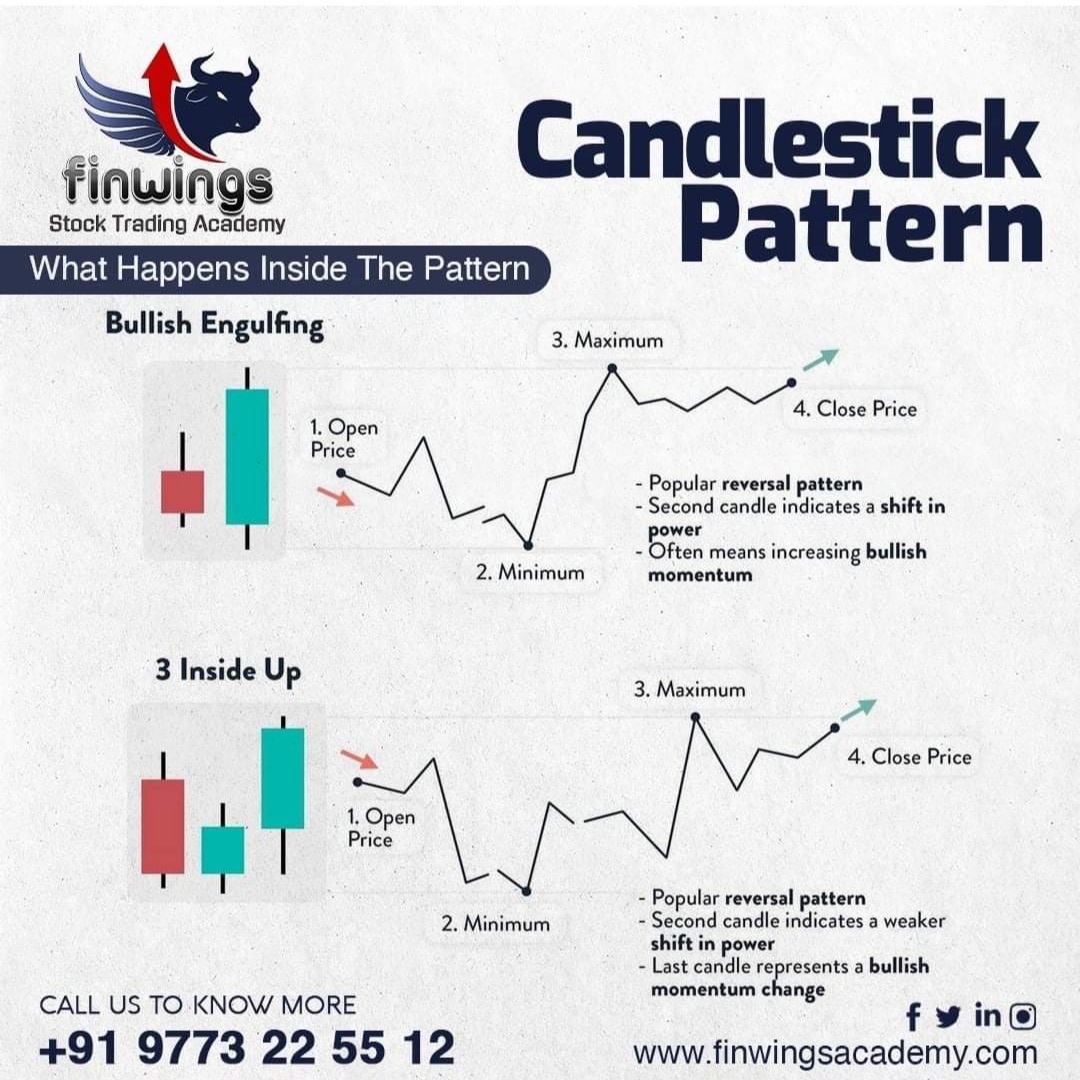
Candlestick pattern provides a much more detailed description of the occurrences and happenings in the market, and interactions between buyers and sellers as compared to traditional charts which provide minimal information. They allow us to understand the sentiment of Investors …
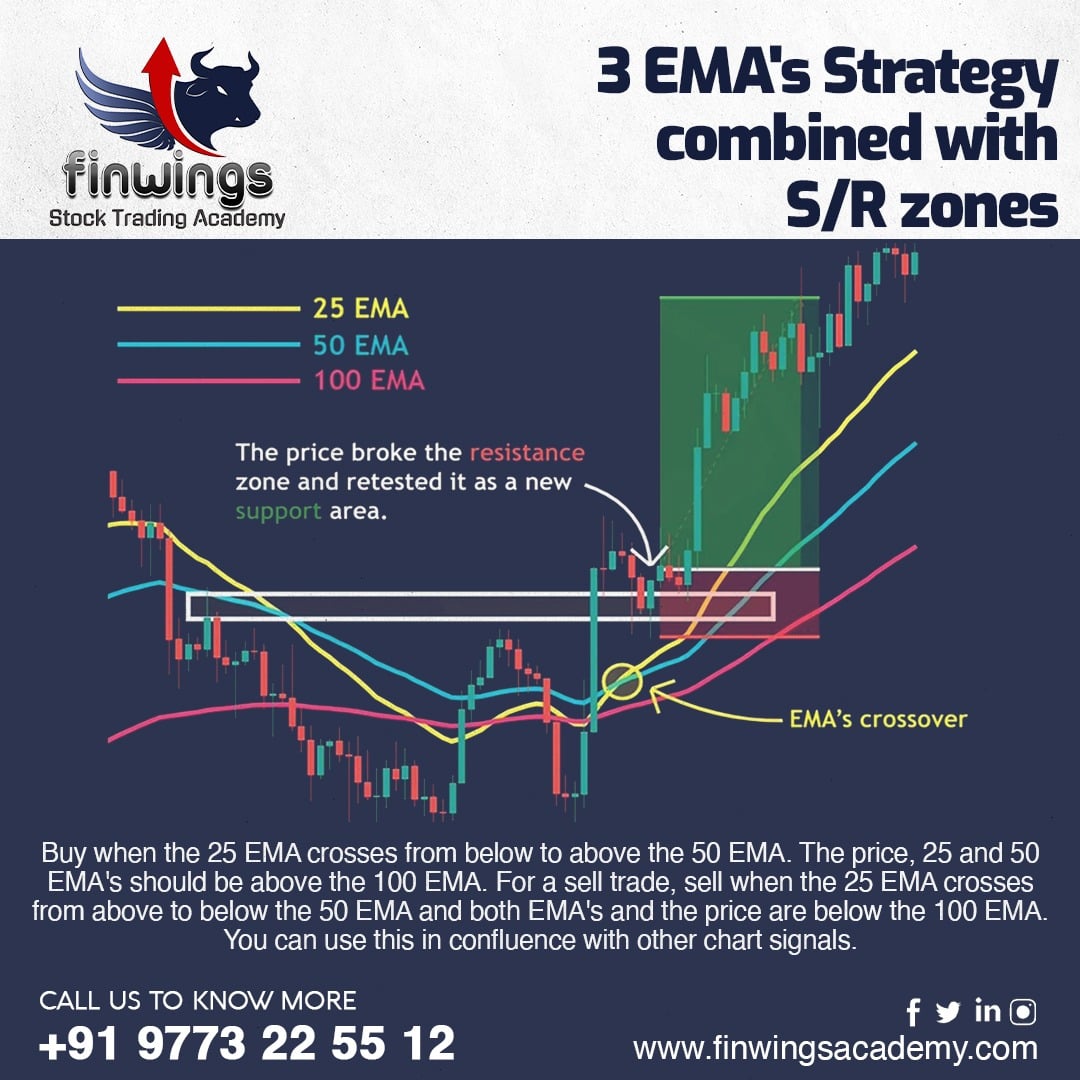
The Exponential Moving Average (EMA) weighs current prices more heavily than prior prices that it takes into consideration. This gives the Exponential Moving Average the advantage of being quicker to respond to price fluctuations than a Simple Moving Average; however, …
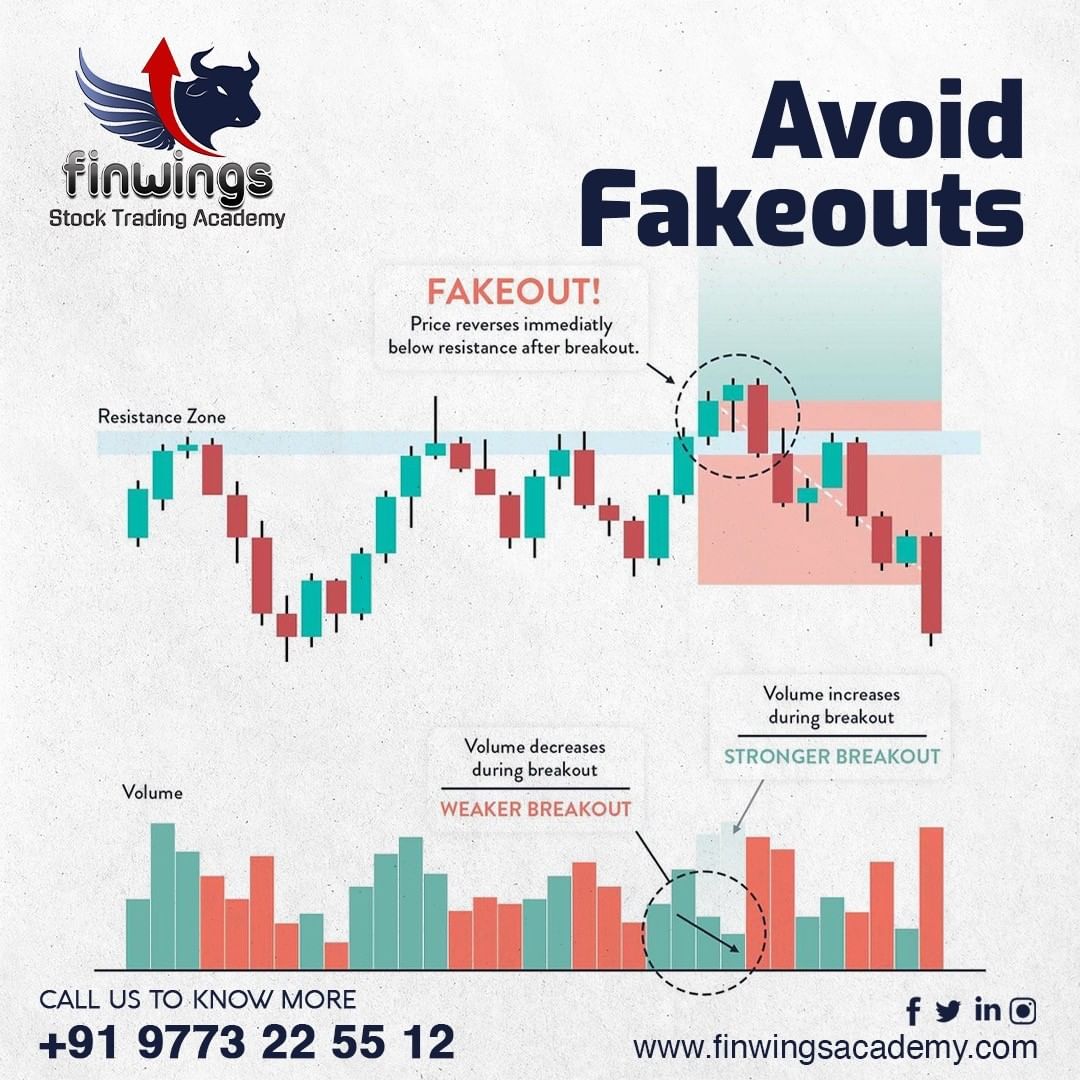
𝐴 𝑓𝑎𝑘𝑒𝑜𝑢𝑡 𝑐𝑎𝑛 𝑐𝑎𝑢𝑠𝑒 𝑐𝑜𝑛𝑠𝑖𝑑𝑒𝑟𝑎𝑏𝑙𝑒 𝑙𝑜𝑠𝑠𝑒𝑠 𝑓𝑜𝑟 𝑎 𝑡𝑒𝑐ℎ𝑛𝑖𝑐𝑎𝑙 𝑎𝑛𝑎𝑙𝑦𝑠𝑡. 𝐼𝑛𝑣𝑒𝑠𝑡𝑜𝑟𝑠 𝑡𝑦𝑝𝑖𝑐𝑎𝑙𝑙𝑦 𝑟𝑒𝑙𝑦 𝑜𝑛 𝑤𝑒𝑙𝑙 𝑡𝑒𝑠𝑡𝑒𝑑 𝑝𝑎𝑡𝑡𝑒𝑟𝑛𝑠, 𝑚𝑢𝑙𝑡𝑖𝑝𝑙𝑒 𝑎𝑓𝑓𝑖𝑟𝑚𝑎𝑡𝑖𝑜𝑛𝑠 𝑜𝑓 𝑎𝑛 𝑖𝑛𝑑𝑖𝑐𝑎𝑡𝑜𝑟 𝑎𝑛𝑑 𝑠𝑝𝑒𝑐𝑖𝑓𝑖𝑐 𝑎𝑙𝑙𝑜𝑤𝑎𝑛𝑐𝑒𝑠 𝑡𝑜 𝑝𝑟𝑜𝑡𝑒𝑐𝑡 𝑡ℎ𝑒𝑚𝑠𝑒𝑙𝑣𝑒𝑠 𝑓𝑟𝑜𝑚 𝑠𝑖𝑔𝑛𝑖𝑓𝑖𝑐𝑎𝑛𝑡 𝑙𝑜𝑠𝑠𝑒𝑠. 𝐖𝐞𝐞𝐤𝐞𝐧𝐝 𝐚𝐧𝐝 𝐰𝐞𝐞𝐤𝐝𝐚𝐲𝐬 𝐛𝐚𝐭𝐜𝐡𝐞𝐬 𝐰𝐢𝐭𝐡 𝐚 𝐦𝐚𝐱𝐢𝐦𝐮𝐦 𝐨𝐟 𝟓 …
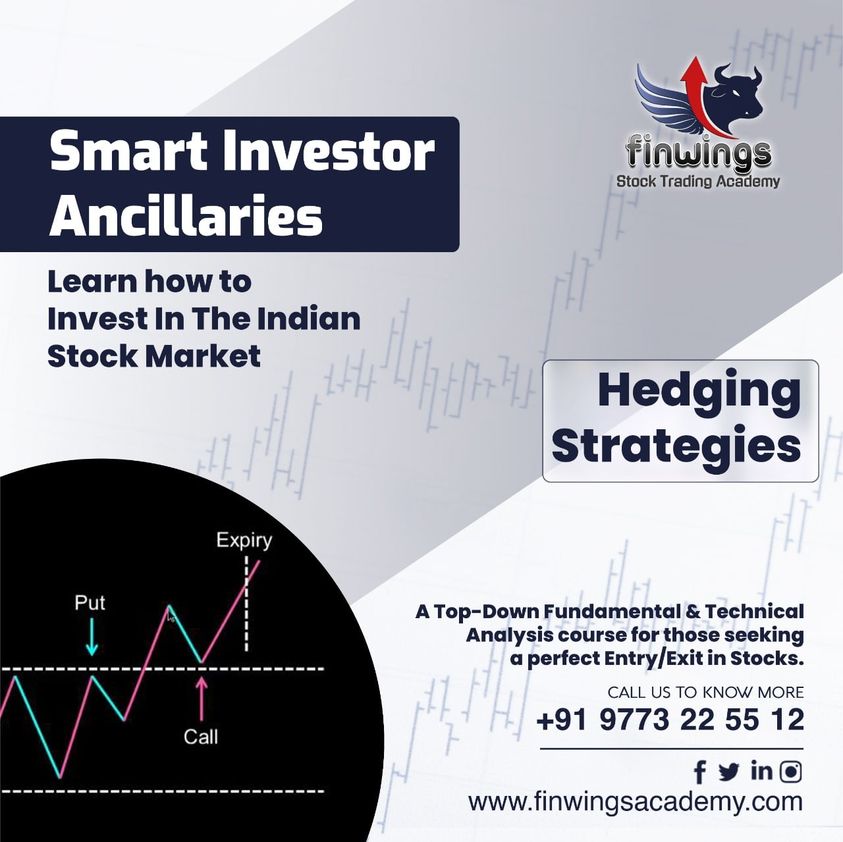
Learn How to Invest in the Indian Stock Market 𝐌𝐚𝐢𝐧𝐭𝐚𝐢𝐧𝐢𝐧𝐠 𝐟𝐢𝐧𝐚𝐧𝐜𝐢𝐚𝐥 𝐝𝐢𝐬𝐜𝐢𝐩𝐥𝐢𝐧𝐞 𝐢𝐬 𝐩𝐚𝐫𝐚𝐦𝐨𝐮𝐧𝐭 𝐢𝐟 𝐲𝐨𝐮 𝐰𝐢𝐬𝐡 𝐭𝐨 𝐫𝐞𝐚𝐜𝐡 𝐲𝐨𝐮𝐫 𝐟𝐢𝐧𝐚𝐧𝐜𝐢𝐚𝐥 𝐠𝐨𝐚𝐥𝐬. 𝐖𝐞 𝐡𝐞𝐥𝐩 𝐚𝐧𝐝 𝐩𝐫𝐨𝐯𝐢𝐝𝐞 𝐬𝐦𝐚𝐫𝐭 𝐢𝐧𝐯𝐞𝐬𝐭𝐨𝐫 𝐚𝐧𝐜𝐢𝐥𝐥𝐚𝐫𝐢𝐞𝐬 𝐭𝐨 𝐬𝐮𝐫𝐯𝐢𝐯𝐞 𝐢𝐧 𝐭𝐡𝐞 𝐈𝐧𝐝𝐢𝐚𝐧 𝐌𝐚𝐫𝐤𝐞𝐭! 𝐖𝐞𝐞𝐤𝐞𝐧𝐝 𝐚𝐧𝐝 𝐰𝐞𝐞𝐤𝐝𝐚𝐲𝐬 𝐛𝐚𝐭𝐜𝐡𝐞𝐬 𝐰𝐢𝐭𝐡 …
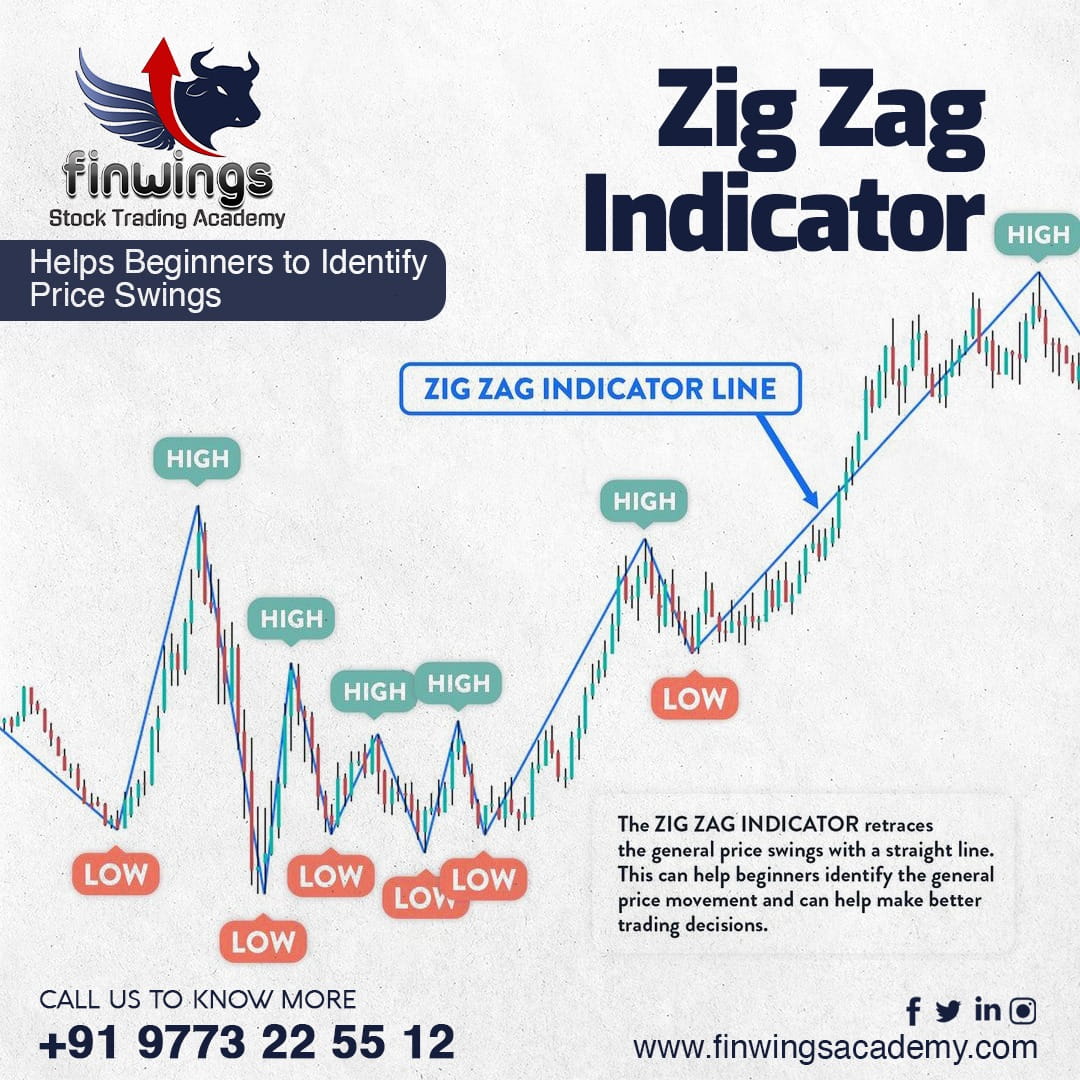
The zig-zag indicator is a basic technical tool that helps traders to find when a price structure’s trend is reversing. Once you know the structure’s support and resistance areas, it helps to identify significant movements in the prices, and then …

Live Market Hours Learning

Lifetime membership

12 Years of Experience

70+ In-house Trading Strategies

30+ Options Trading Strategies


4.9 Rated on
Google 247 Reviews