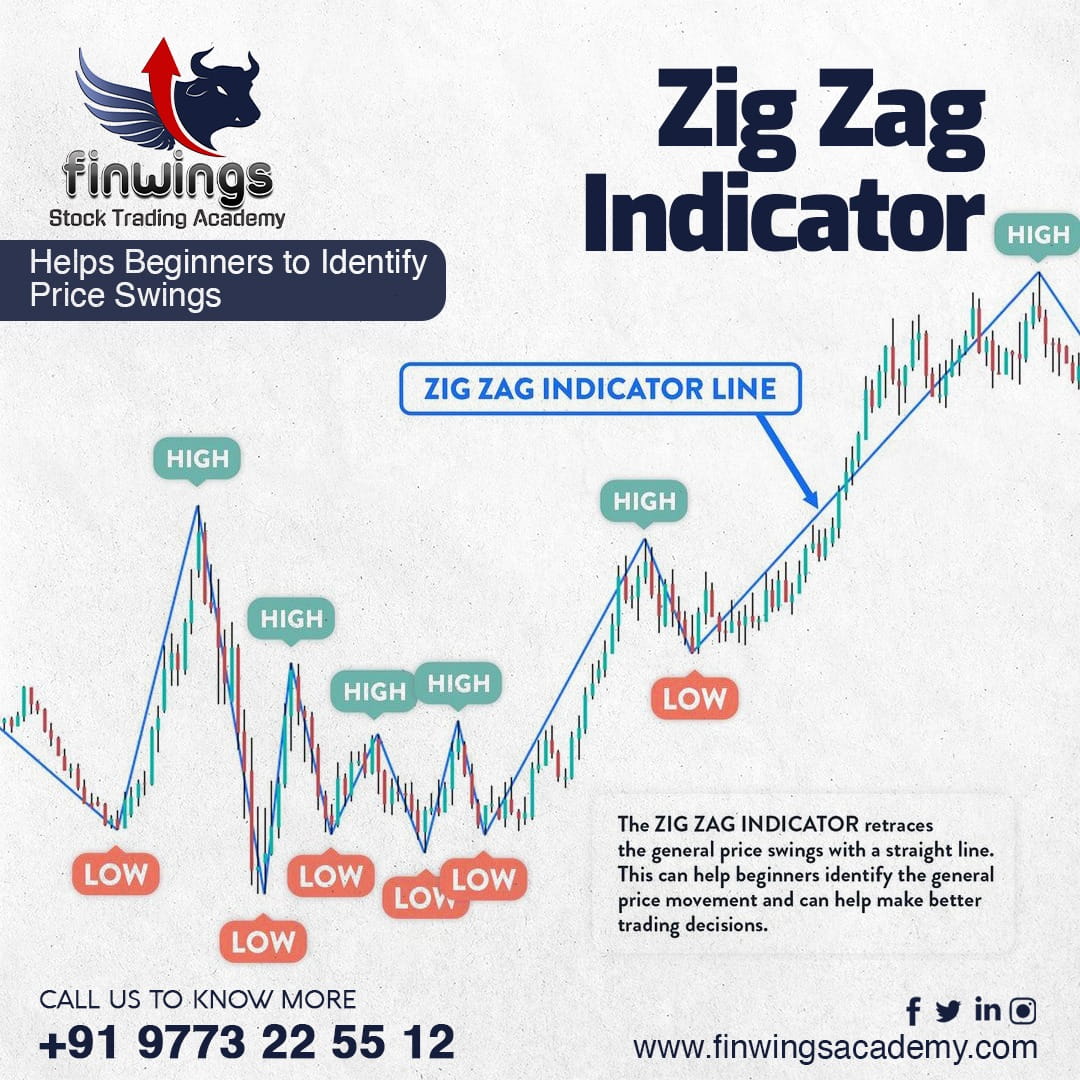
What is a ZIGZAG Indicator? How to interpret a dominance of a trend?
The zig-zag indicator is a basic technical tool that helps traders to find when a price structure’s trend is reversing. Once you know the structure’s support and resistance areas, it helps to identify significant movements in the prices, and then filtering out short-term fluctuations, we get to know a smooth direction of the trend eliminating the market noise.
The ZigZag indicator is more helpful for Swing and short-term traders who tend to exit on trend reversal with trailing their Stoplosses.
The Zig Zag Indicator
To use the zig zag indicator, a percentage of price movements must be set. Although the default value for a zig-zag is 5%, a setting of 10% would ensure that only price fluctuations of 10% or more would be shown in the chart with a line plotted overlapped on the price as shown in the above image. This eliminates smaller price swings and allows the analyst to see the bigger movements and act accordingly.
𝐋𝐢𝐧𝐤𝐞𝐝𝐈𝐧: https://www.linkedin.com/company/finwings-stock-trading-academy/
𝐓𝐰𝐢𝐭𝐭𝐞𝐫: https://twitter.com/FinwingsA
Call Now for More Details – 9773225512
#candlestickpatterns #technicalanalysis #priceactiontrading #supportresistance #trendanalysis #intradaytrading #swingtrading #optionstrading #momentumtradingstrategy #nifty50 #trendlines #fibonnaci #tradingstrategy #head&shoulders #chartpatterns #zigzagindicator


