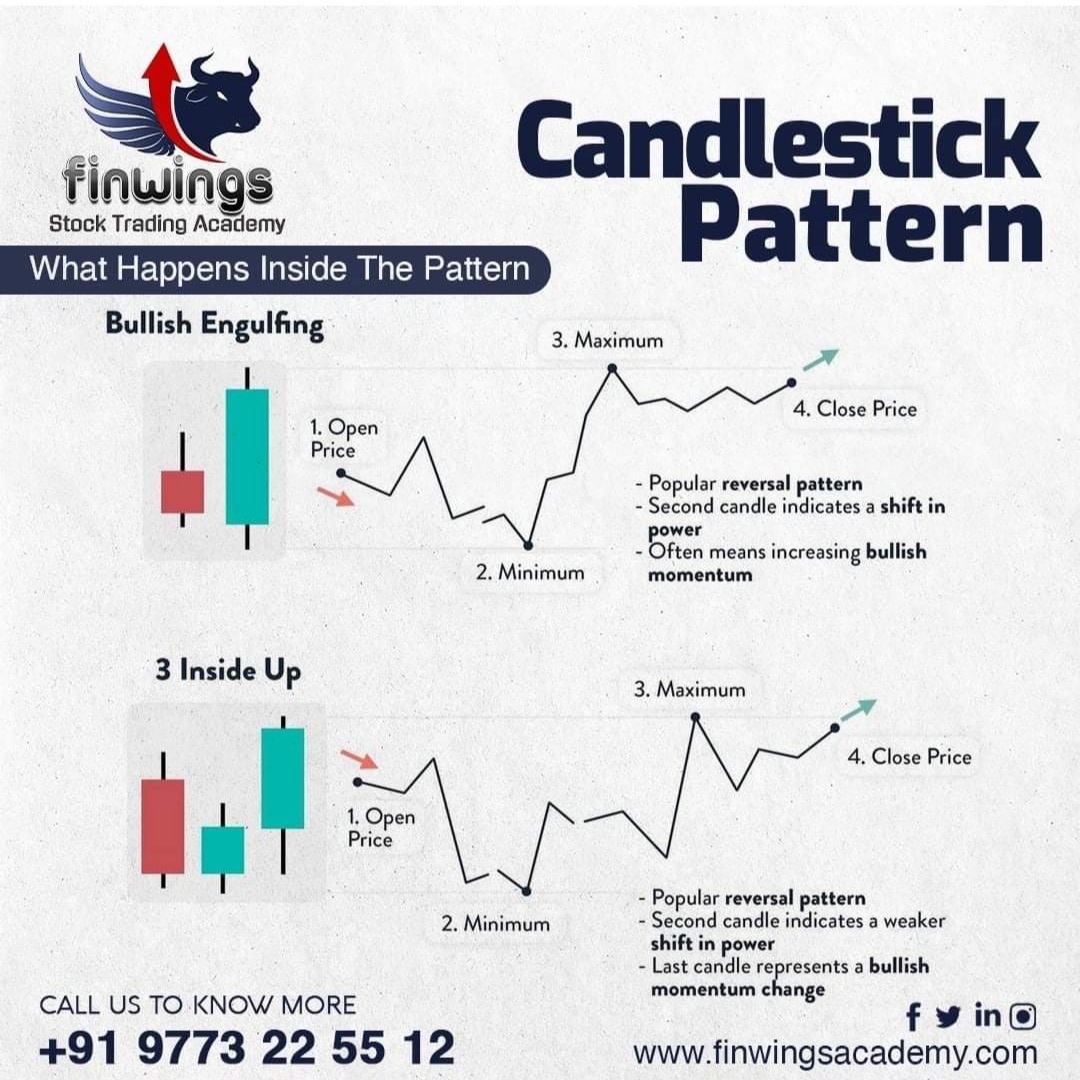
How to Study Candlestick Patterns and Interprete them? Know what is happening inside a candlestick formation.
Candlestick pattern provides a much more detailed description of the occurrences and happenings in the market, and interactions between buyers and sellers as compared to traditional charts which provide minimal information.
They allow us to understand the sentiment of Investors and the values being determined by the market. They indicate market turning points early and estimate the direction of the market.
Overall, Candlesticks provide unique insights and display reversal or continuation patterns that cannot be seen in other types of charts. They can be used in all kinds of markets and all timeframes.
What Candlestick don’t tell you?
Candlesticks do not reflect the sequence of events between the open and close, only the relationship between the open and the close. The high and the low are obvious and indisputable, but candlesticks (and bar charts) cannot tell us which came first.
With a combination of different candlesticks, we can get to know the dominance of Buyers/Sellers. The candlestick patterns give a complete path, whether the buyers dominated first or the sellers and accordingly we can enter the trade.
*Sometimes different candlestick patterns tell the same story as shown in the above image.
𝐖𝐞𝐞𝐤𝐞𝐧𝐝 𝐚𝐧𝐝 𝐰𝐞𝐞𝐤𝐝𝐚𝐲𝐬 𝐛𝐚𝐭𝐜𝐡𝐞𝐬 𝐰𝐢𝐭𝐡 𝐚 𝐦𝐚𝐱𝐢𝐦𝐮𝐦 𝐨𝐟 𝟓 𝐫𝐞𝐠𝐢𝐬𝐭𝐫𝐚𝐭𝐢𝐨𝐧𝐬 𝐩𝐞𝐫 𝐛𝐚𝐭𝐜𝐡.
𝐋𝐢𝐧𝐤𝐞𝐝𝐈𝐧: https://www.linkedin.com/company/finwings-stock-trading-academy/
𝐓𝐰𝐢𝐭𝐭𝐞𝐫: https://twitter.com/FinwingsA
Call Now for More Details – 9773225512
#candlestickpatterns #technicalanalysis #priceactiontrading #supportresistance #trendanalysis #intradaytrading #swingtrading #optionstrading #momentumtradingstrategy #nifty50 #trendlines #fibonnaci #tradingstrategy #head&shoulders #chartpatterns #zigzagindicator


