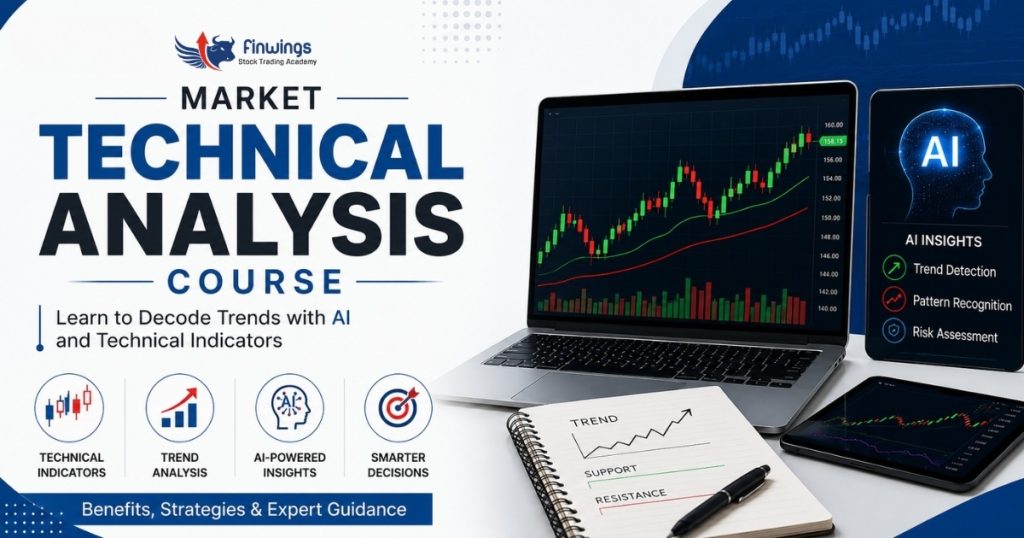
Markets don’t wait around. Prices are moving by the minute, and if you are guessing rather than reading what is happening on the chart, you are already behind. This is where a market technical analysis course earns its keep – it teaches you to read price movement, spot patterns, and make calls based on data rather than gut feeling. Pair that with AI tools that can crunch years of price history in seconds, and you’ve got a much sharper approach to trading, whether you’re just starting or brushing up old skills.
Why a Market Technical Analysis Course Actually Matters
Forget hunches and Twitter tips. A proper course teaches you to read price behaviour on its own terms. Most modern programmes now fold in AI-assisted analysis too, which speeds up the process of spotting opportunities — though it’s still your judgement doing the heavy lifting.
Technical analysis isn’t about predicting tomorrow. It’s about weighing probabilities using past price action, volume, and a bit of market psychology. Combine that with real risk management, and you’ve got a framework that works across stocks, forex, commodities, and indices alike.
What AI Brings to Market Trend Analysis
AI doesn’t replace thinking — it just does the grunt work faster. It can churn through mountains of historical data and flag things for market trend analysis worth a second look:
- Recurring chart patterns
- Odd spikes in price or volume
- Momentum shifts
- Faster screening across markets
- Backtesting ideas before you risk real money
Even so, the best traders still double-check every AI-flagged signal against actual price structure before pulling the trigger.
The Stock Market Indicators Worth Knowing
Stock market indicators turn messy price action into something you can actually read. A few worth learning properly:
- Moving Averages — smooth out the noise, show the bigger trend
- RSI — flags when something’s overbought or oversold
- MACD — picks up on momentum shifts and possible reversals
- Bollinger Bands — track volatility and unusual price swings
- Volume — tells you whether a move actually has conviction behind it
No single indicator tells the whole story — that’s why traders usually lean on two or three that suit their style.
Technical Trading Strategies That Hold Up
Consistency beats cleverness, most of the time. A decent course with proper technical trading strategies walks you through trend-following, breakout trades, support and resistance, swing trading, and momentum plays — then teaches you to build clear entry, exit, and stop-loss rules around whichever one fits you.
Why a Chart Reading Course Still Matters
Charts show you what buyers and sellers are actually doing, not what a headline says they’re doing. A solid chart reading course covers candlesticks, trendlines, price action, chart formations, and reading across multiple timeframes — skills that stick long after any single trade.
Mistakes Worth Avoiding Early
Relying on one indicator, skipping risk management, trading without a plan, chasing wins, following random tips online, or expecting AI to call every move — these sink beginners fast. Discipline beats impulse, every time.
Learning With Finwings Academy
Technical analysis is about understanding how markets actually behave, not chasing predictions. Finwings Academy develops that understanding through hands-on chart work, AI-powered tools, and real risk management training–practical skills for traders who want to grow with the market, not against it.
FAQs :
What is a market technical analysis course?
Put simply, it’s where you learn to read a chart properly — spot trends, understand what’s driving price, and use the right tools to back up a decision. A good market technical analysis course also brings in AI support and proper risk management, not just theory.
2. Is AI replacing technical analysis in trading?
Not really. AI’s good at chewing through data and flagging patterns fast, but it can’t read context or manage risk on its own. That part’s still down to you. The best traders treat AI as a shortcut, not a substitute for actual judgement.
3. What are the basic stock market indicators for beginners?
Start simple: Moving Averages, RSI, MACD, Bollinger Bands, and Volume. Understanding how these stock market indicators work together, rather than picking a favourite and sticking with it, gives you a much clearer picture before you risk anything real.
4. Why is chart reading important for technical traders?
Because charts show you what is actually happening, the patterns, the support and resistance, the sentiment, without the noise of opinions or headlines. A chart reading course hones that skill so that decisions come from what you see, and not from gut reaction during a volatile session.
5. Do technical trading strategies work in different market conditions?
Yes, if you adapt them. A technical trading strategy made for trending markets will not work the same way in a choppy, range bound market. Review what’s working, always be disciplined about risk and adjust your approach as conditions change instead of sticking rigidly to one method.