Market have resumed the trend after 2 months of consolidation with a faltering intent.
Daily Time frame Analysis

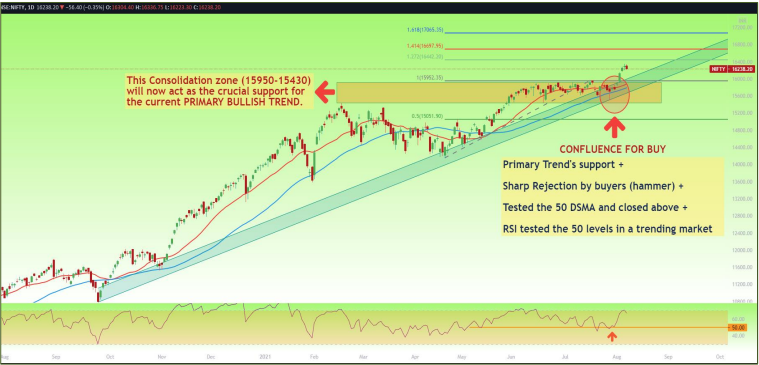
- Indian market finally broke out from its two-month consolidation and rose to all-time high levels. Nifty50 added 475.15 points (3 percent) to end at 16,238.20 in the week gone by.
- India’s recovery rate from Covid cases now stands at 97.37 percent.
- Industrial production for June and CPI inflation for August will be released on Thursday.
- Foreign institutional investors turned net buyers after several weeks of selling. FIIs net bought Rs 2,616.04 crore worth of shares in the week ended August 6, after withdrawing more than Rs 23,193 crore in July.
- Nifty on the weekly chart has formed a long bull candle. The weekly RSI stood at 69.39. It remains neutral and does not show any divergence against the price. The weekly MACD has shown a positive crossover; it is now bullish and stays above the signal line.
- After hitting fresh intraday record highs in the initial hour of trading on Friday, Nifty50 got caught in a bear trap on Friday amid volatility.
- As long as RSI in daily charts stays above 60 we may see the 16440-16550 levels in coming 5-8 trading sessions. The trend zone (blue) will act as the trailing support in confluence with the 20&50 DSMA.
- The Fibonacci 1.272 extension level for the recent minor trend falls around 16440 and will also be short term resistance.
- The option data also indicated that the upper end of the trading range is 16,500 levels which is expected to be resistance in the coming days, and 16,000 as the lower band could be a crucial support level for the Nifty.
- Nifty futures open interest has increased to highest levels seen since March as range bound movement seen in the last couple of months. The current open interest in the Nifty is more than 25 percent higher than that seen in the July series. In a synergy, net longs from FIIs have also increased sharply, till we do not see closure of positions, positive bias should continue.
Hourly Time frame Analysis

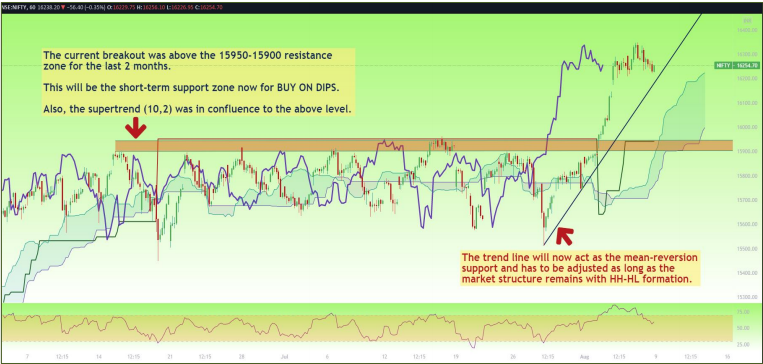
- The nifty in hourly chart supported 16210-16240 zone after the breakout of the current consolidation and will be the immediate decider of the minor trend.
- An INSIDE BAR formation was seen in the daily chart, indicating a consolidation session ahead as the participation remained subdued on Friday.
- Decoding the ichimoku cloud’s components- Lagging Span suggests the trend to continue as long as it takes support of the prior prices. –The Leading Span A&B suggests strength with a healthy future cloud formation and moving upwards. They will also be the dynamic supports and can be trailed as stop-loss for long positions.
- The UP trend line as shown in the chart has to be adjusted if it is breached but Lows formation should be Higher than the prior Low (HL). This will hint us to trade the Buy on Dips.
- Hourly RSI at 60.47, easing of the momentum from the overbought zone. Now the trend will remain up as long as it supports the 40 or 50 level. The current formation hints the strength in the uptrend.
- Any dip towards 16070-16150 support zone will be a good buying opportunity for intraday and swing traders.
- The 15950-15900 zone will be reversal levels for the positional traders.
- If the ATH (16350) is breached at the starting of the week a stop-loss of 16200 can be maintained for the target of 16440-16550 for the rest of the week.
- India VIX fell to 12.60 from 12.80 levels on week-on-week basis which gives stability to the market.
IMPORTANT LEVELS TO WATCH FOR INTRADAY AND SWING TRADING
15950 – 16070 – 16125 – 16280 – 16350 – 16440 – 16565
ALGO-ROBO TRADING PLATFORM

Finwings stock trading academy is one of the best stock trading academies in India providing crash courses, short term courses and medium-term courses focusing on those who wants to be a trader or invest in the Indian stock market. We offer careeroriented courses like ;a part of BFSI, NSE courses, SEBI courses and BSE certification courses which are considered principle series to excel your career in the financial market. We offer both online as well as offline lectures. We are here to train the individuals from basic to the advanced level along with necessary theoretical and practical knowledge. We conduct various tests and virtual analysis to measure the performance of our students.
Apart from the training related trading and investment, our academy provides different financial services to retail traders seeking to generate consistent profit from the stock market.
Why FINWINGS Stock Trading Academy?
- We provide our software for linking ALGO trading to your De-mat account.
- We have our own self developed and back-tested strategies for different segments.
- Anyone can create their own trading strategy on our platform with easy comprehension.
- Fully risk managed strategies with lowest slippage in the market.
- Low Fixed-Cost trading setup for small traders – No profit sharing to us.
- Full life-time backhand support to our clients.


