Last session’s bullish candle imply the dominant bulls.The market structure now clearly suggests buy on dips from every support in lower time frames.
Daily Time frame Analysis

- On Friday Nifty 50 the benchmark Indices closed at 15175 (+269.250 or +1.81%)
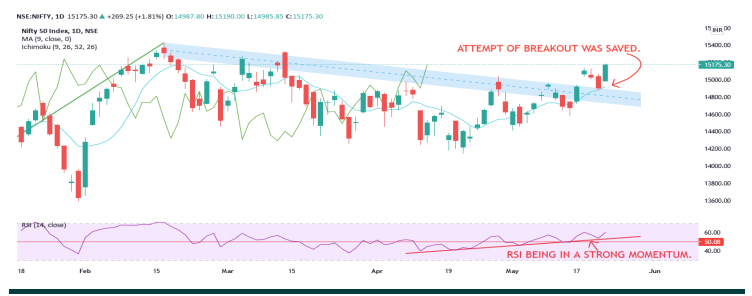
- Nifty seems to hold the breakout from a falling channel, Bulls were able to uphold the market with strong positive closing after two corrective sessions. (as shown in chart)
- Strong momentum was observed in the last hour where the market surpassed 3-months high and managed to close near the day high.
- Banking & NBFCs were the Top performers in the last session lifting Nifty to form a healthy bullish candle
- Pharma and PSU sectors underperformed amid the rally.
- RSI suggests stringent up move as the indicator forms a HH-HL structure and managed to stay above 50 level.
- FII Derivative data indicates a strong LONG BUILD UP in INDEX FUTUREs. Nifty may continue the further uptrend, but might move in a neutral or consolidating structure before the next move. 14900- 14840 will be trailed support zone in the coming whole week.
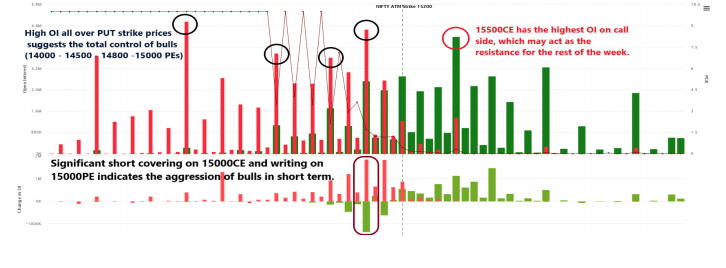
- Strong SHORT COVERING was seen 15100CE from 36 Lakh OI to 25 Lakh OI, strong PUT WRITING was seen on 15100PE & 15200PE with an addition 15 lakh and 10 lakh fresh OI. All the buildup suggests downside is capped.

Hourly Time frame Analysis

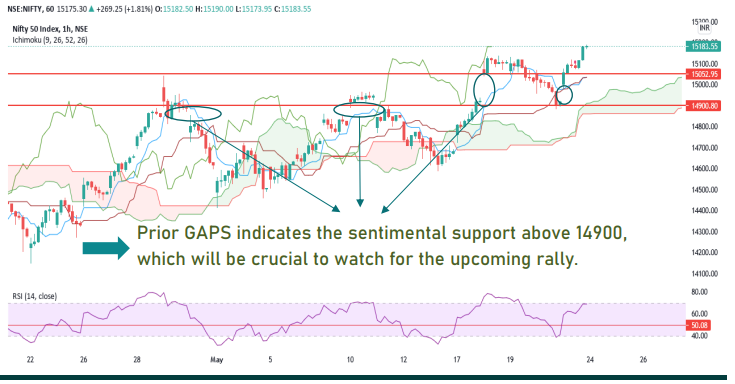
- Closing above the crucial resistance zone (15010-15080) suggests that the momentum may continue in coming sessions with minor breathers. (slight profit booking)
- Applying ICHIMOKU CLOUD in an hourly time frame, LAGGING Span supported the prior prices and moving upwards indicates the buildup is strong and convenient. The future cloud is green and moving upwards indicates the same. The LEADING Span A&B (plotted in future- green & red area that indicates the cloud) will act as the dynamic supports for the continuing uptrend. (Now Leading Span A = 15037 & Leading Span B = 14890)
- The Base Line (Brown line) will be the support/reversal for the current up move which also same as the Leading Span B.
- RSI Momentum Indicator supported 40 level, which is dominant buyers support in any uptrend, now every dip in the prices must respect this level to move up further.

Finwings stock trading academy is one of the best stock trading academies in India providing crash courses, short term courses and medium-term courses focusing on those who wants to be a trader or invest in the Indian stock market. We offer career-oriented courses like ;a part of BFSI, NSE courses, SEBI courses and BSE certification courses which are considered principle series to excel your career in the financial market.
We offer both online as well as offline lectures. We are here to train the individuals from basic to the advanced level along with necessary theoretical and practical knowledge. We conduct various tests and virtual analysis to measure the performance of our students.
Apart from the training related trading and investment, our academy provides different financial services to retail traders seeking to generate consistent profit from the stock market.
Why FINWINGS Stock Trading Academy?
- We provide our software for linking ALGO trading to your De-mat account.
- We have our own self developed and back-tested strategies for different segments.
- Anyone can create their own trading strategy on our platform with easy comprehension.
- Fully risk managed strategies with lowest slippage in the market.
- Low Fixed-Cost trading setup for small traders – No profit sharing to us.
- Full life-time backhand support to our clients.


