Harmonic Patterns: AB=CD
Learn Trading the Harmonic Patterns
Since the introduction of harmonic patterns in Harold M. Gartley’s 1935 book, Profits in the Stock Market, a lot has changed. So it’s inevitable that the original Gartley 222 pattern would undergo some developments as well – after all, the only thing that remains constant is change. Browsing the internet, one comes across many different variations of the original harmonic pattern. What these patterns have in common is the adoption of Fibonacci ratios as a prerequisite.
The AB=CD Pattern
One of the authors on the subject, Scott M. Carney, refined the pattern by assigning new elements and specific Fibonacci ratios to confirm the formation. The result is what is known today as the AB=CD pattern.
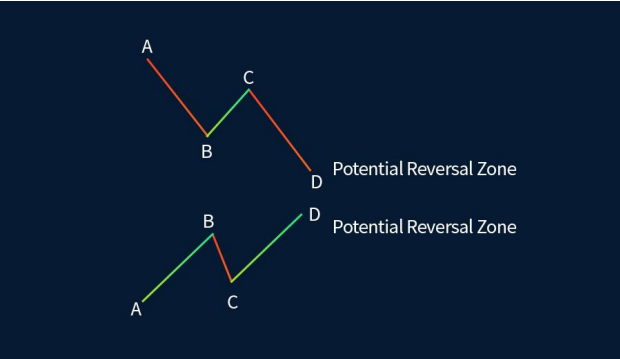
The Perfect Bullish AB=CD Pattern
When the structure conforms to the following specifications, then it qualifies as a perfect bullish
AB=CD pattern
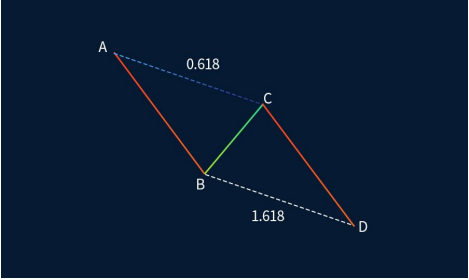
The specifications are the following:
- AB=CD
- BC retraces 0.618 of AB
- CD terminates at the 1.618 projection of BC
- Equal time of duration for AB and CD
Even though time is not the most reliable factor in technical analysis, it is nevertheless an element of the unique specifications of the perfect AB=CD pattern. One way to measure the time required for each leg (i.e. AB, CD) to complete is to simply count the corresponding candlesticks that comprise each of the legs.
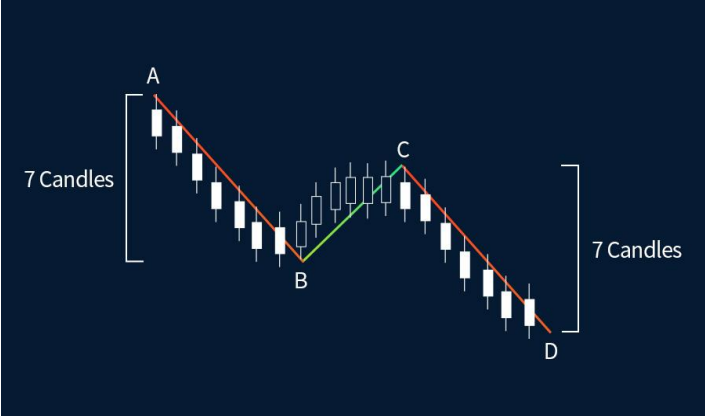
The Perfect Bearish AB=CD Pattern
Similarly, the same rules apply when identifying the perfect bearish AB=CD pattern:
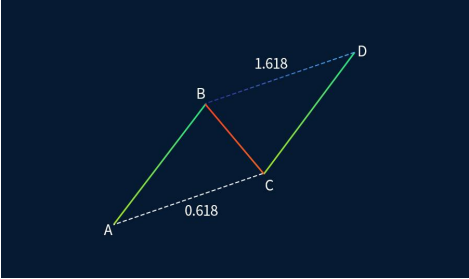
- AB=CD
- BC retraces 0.618 of AB
- CD terminates at the 1.618 projection of BC
- Equal time of duration for AB and CD
If we take a closer look at a real price chart, we can clearly see that the example below qualifies as a perfect bearish AB=CD pattern.
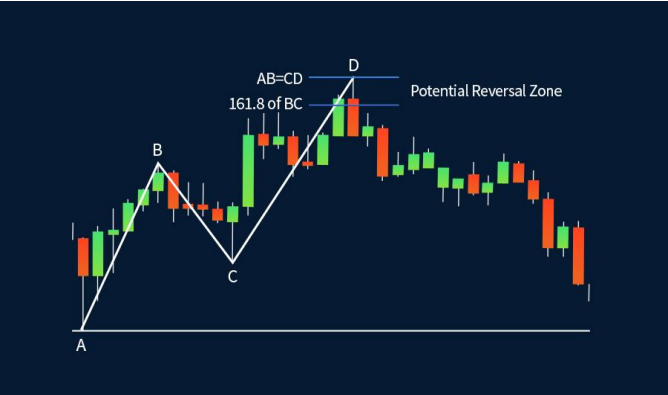
Point D is defined by the completion of the CD leg that satisfies the condition AB=CD. Also, notice the Potential Reversal Zone which fulfils both required conditions: 161.8 projection of BC and AB=CD.
The Reversal Bar, also known as the Terminal Price Bar, tested both lines (161.8 of BC and AB=CD). The only condition that came close, but is not 100% fulfilled, is the time factor.
The leg CD took more time to form compared to leg AB. It should be emphasized again that time is not a very reliable factor.
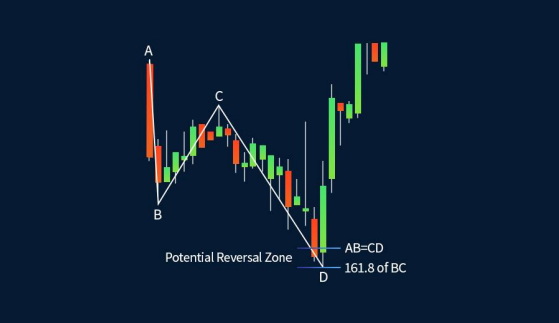
Here is another example of a real price chart; this time showing a bullish AB=CD pattern.
Again, all conditions are met, with the exception of the time factor.
The CD leg required much more time to complete compared to the AB leg, as this was of considerably shorter time duration.
Trading the AB=CD Pattern
Trading the AB=CD pattern involves rules for entering the trade, locking potential profits and exiting with minimum loss if the market follows the opposite direction.
The entry in the trade, whether buy or sell, is triggered once the pattern is in place. In the following chart, the completion of the pattern takes place at point D, where AB=CD. Furthermore, the 161.8 projection of BC along with point D defines the Potential Reversal Zone. In this case, the Terminal Price Bar hammer-tested both point D and the 161.8 projection of BC. The existence of the hammer at the end of the pattern signals the end of the bearish move and the beginning of a new move to the upside. This is your buy entry.
As no trade is 100% guaranteed to be profitable, it makes sense to place a protective stop loss below the Potential Reversal Zone. After all, the word ‘potential’ implies that the pattern may reverse to the upside or continue following the prevailing trend. If the latter takes place, then the pattern will be invalidated and the buy position will need to be exited.
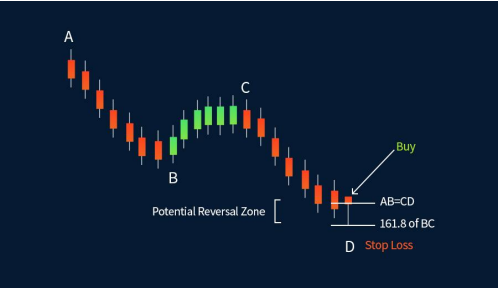
Take profit is more subjective as it offers different options. An initial profit, usually 50% of the position, may be booked at the 0.618 marks between the high (point A) and the low (point D) of the pattern.
The remainder may be booked using a 0.382 trailing stop or trendline violations.
What is the bullish AB CD pattern?
AB=CD, which indicates that the length of both legs is equal to confirm a trend reversal, is a bullish ABCD pattern. A typical ABCD pattern also has BC being either 61.8 or 78.6 percent of AB and CD being either 127.2 or 161.8 percent of BC. Additionally, there is a situation where CD is 127.2 or 161.8% of AB. The ABCD extension is the name of this structure. However, a transaction is anticipated at point D in both the classic and extended scenarios.
What is AB CD in trading?
A reversal pattern called AB=CD may be used to spot when the price is ready to turn around. You can sell when prices are high but about to decline or purchase when they are low and going to increase, according to the theory.
How do you trade an ABCD harmonic pattern?
You must first identify the indicator, expand your study, and then configure your trading alerts in order to trade with the ABCD pattern. You should keep in mind that the chart pattern evolves across a range of periods, so as part of your study, you should look at trade charts over the short, medium, and long term.
How do I know my AB CD pattern?
Traders search for the legs, or the movements between points, to discover the ABCD pattern. AB and CD stand for movements in the general trend’s direction, whereas BC represents a retracement. Usually, each leg lasts three to thirteen bars. Move to a larger time frame and look for trend/Fibonacci convergence if you see an ABCD with legs that last longer than 13 bars.
What is the ABCD pattern rule?
Trading’s abcd pattern is an intraday chart pattern that captures the market’s organic movement. It includes a first leg up or leg down, a brief consolidation, and then a second leg up or down in the direction of the original move.


