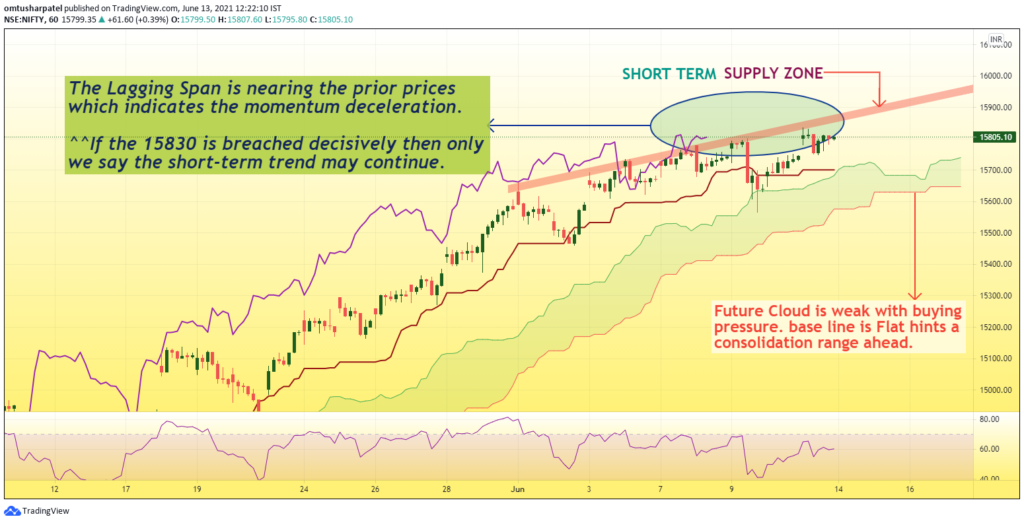
After the stellar run- Nifty may move conspicuously in the coming week.
Daily Time frame Analysis
- On Friday Nifty 50 the benchmark Indices closed at 15799.35 (+61.60) (+0.39%).
- After Opening with a Gap-up Nifty 50 Consolidated, where buyers & sellers both were active ending the day at same opening point. (Forming a DOJI at top of the UPTREND)
- The trading range remained narrow of 268 points against 359 points in the week before.
- Market consolidating at ALL-TIME HIGHs and Low India VIX raises suspicious sessions ahead.
- VIX remains at its lowest level of recent time and this indicates a period of low volatility and complacency. Such periods are often followed by a spike in volatility and can lead to a period of high volatility. Such events may trigger measured corrective movement, and if not, can at least push the market again into a broad range-bound consolidation.
- The market is moving towards becoming highly stock-specific and warrants a very efficient risk management by the participants.
- The current minor trends retracement come around 15300-15450 support zone as per horizontal support levels.
- The weekly RSI is 69.09; it may show a strong bearish divergence against the price. Also the Daily RSI at 69.87 indicates the same, expect the momentum to decelerate.
- The weekly MACD has shown a positive crossover; it is now bullish and above the signal line. The broader trend remains bullish with Buy on dips with buying pressure followed by the institutions.
- Strong CALL WRITING was seen on the strike price CE15800, CE15900, CE16000, whereas only the strike price of PE15700 witnessed PUT WRITING.
- According to futures OI data nifty and bank nifty both witnessed increase in contracts but prices were mixed, which rises the dilemma where the trend will head this week.
- FII derivative OI DATA suggest they still are long in indices with 83% long vs 17% short. Options Data indicates Volatile sessions in coming days amid the increased Call short positions.
Hourly Time frame Analysis

- In the Last week report as described the hourly chart formation was exact as predicted. So now the consolidation has intensified and may lead to a make or break move.
- The Resistance-supply zone fall around 15900-16000 as shown in the above chart.
- In daily chart according to Ichimoku cloud the prices are overstretched as the distance between the cloud and Current Market Value (CMV) is significant. Now looking the hourly Ichimoku cloud, future cloud is green but flat indicates if the prices fails to hold the Leading Span A&B in coming sessions we might see a selloff triggering towards 15300-15450 levels.
- Lagging Span is near the prior prices, which not good as per the positional trader’s intent, if the lagging Span moves below the prices and stays below it will be the confirmation of the minor trend correction.
- Base line can be used as the trailing stop loss for the short term traders. Currently it is flat and indicates that momentum is fragile.
- On contrary the upside will only trigger with hourly closings above the ATH (15830) with dominating bullish candles.
- RSI is consolidating in the 70-30 mark indicates a moderate divergence at an end of the uptrend. If RSI finds resistance at 60 level in coming session after hitting 30 or below levels then the short term trader will try to protect their long positions fueling the selloff on intraday basis.

Finwings stock trading academy is one of the best stock trading academies in India providing crash courses, short term courses and medium-term courses focusing on those who wants to be a trader or invest in the Indian stock market. We offer career-oriented courses like ;a part of BFSI, NSE courses, SEBI courses and BSE certification courses which are considered principle series to excel your career in the financial market.
We offer both online as well as offline lectures. We are here to train the individuals from basic to the advanced level along with necessary theoretical and practical knowledge. We conduct various tests and virtual analysis to measure the performance of our students.
Apart from the training related trading and investment, our academy provides different financial services to retail traders seeking to generate consistent profit from the stock market.
Why FINWINGS Stock Trading Academy?
- We provide our software for linking ALGO trading to your De-mat account.
- We have our own self developed and back-tested strategies for different segments.
- Anyone can create their own trading strategy on our platform with easy comprehension.
- Fully risk managed strategies with lowest slippage in the market.
- Low Fixed-Cost trading setup for small traders – No profit sharing to us.
- Full life-time backhand support to our clients.


