
How to identify Head & shoulders patterns on charts and take possible trading entries??
Head & Shoulders Pattern is a Bearish Reversal chart pattern usually identified in a primary downtrend or at the end of a primary uptrend. However, there are also some different interpretations of the chat patterns that can be analyzed in sideways trend and also sometimes used as a bearish continuation pattern in some cases.
- A Head and Shoulders reversal pattern forms after an uptrend.
- The pattern contains three successive peaks with the middle peak (head) being the highest and the two outside peaks (shoulders) being low and roughly equal.
- The head and shoulders reversal pattern is made up of a left shoulder, head, right shoulder, and neckline. Other parts playing a role in the pattern are volume, the breakout, price target, and support turned resistance.
- Identification of neckline support and volume confirmation on the break can be the most critical factors.
- Stop loss will be above the high of the Right Shoulder.
- The distance from the neckline to the top of the head will be the target.
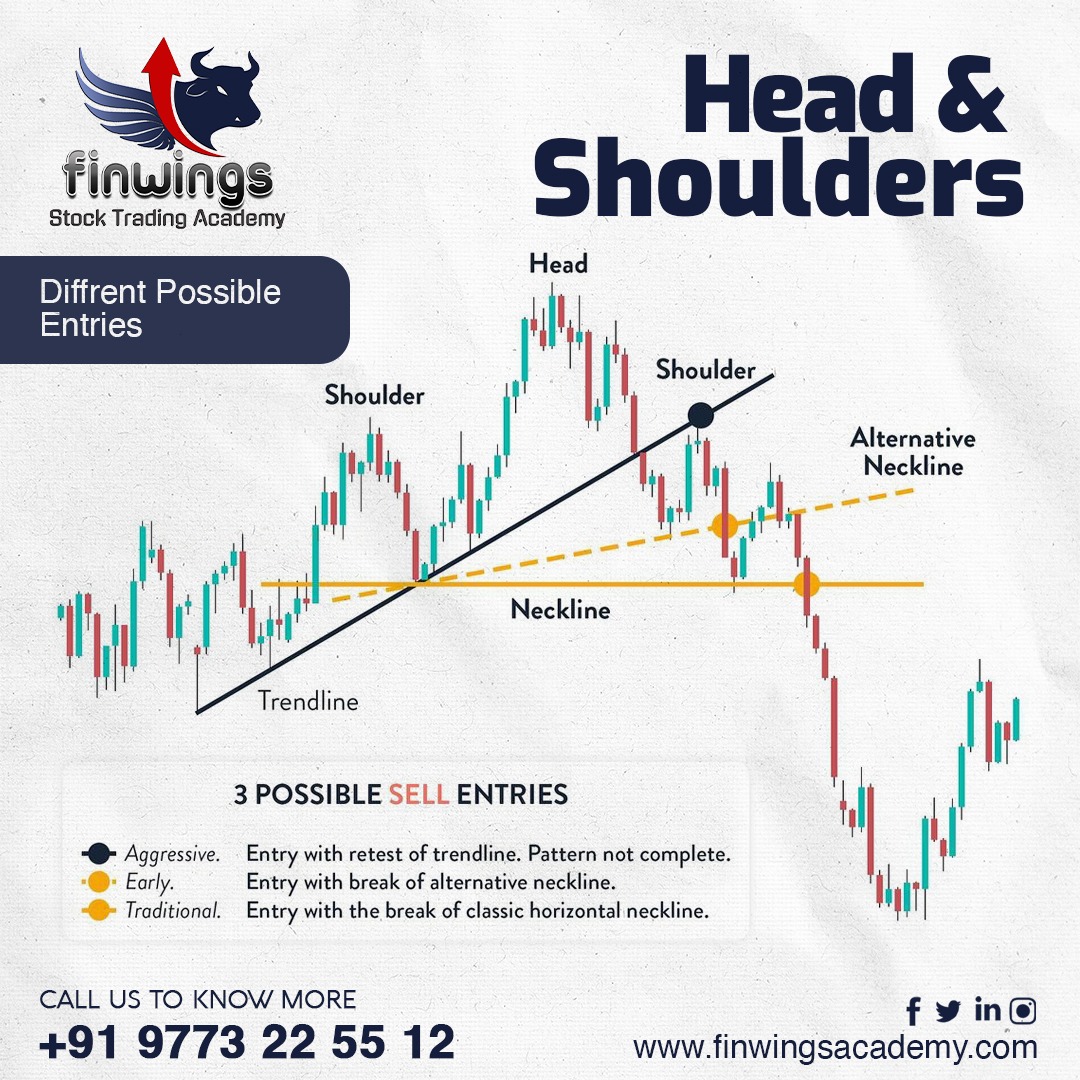
The 3 possible entries in the head & shoulders pattern are shown above in the image.
- Aggressive entry to get a better Risk Reward after the trend line breakout’s retest
- Early entry before the neckline break
- Traditional entry after the breakout of the neckline, which also gives you the least reward among other entries but with greater confirmation.
How do you identify a head and shoulders pattern?
Identifying a head and shoulder pattern is easy and with some practice can be mastered. When investors who have been driving a stock higher momentarily lose interest, the left shoulder develops. The head is formed when excitement reaches its height and then begins to fall to a level at or very close to the stock’s previous low. The formation of the right shoulder aligns with the stock price’s subsequent rally, which falls short of its prior peak.
How do you identify a trading chart pattern?
Identifying a trading chart pattern is not easy and takes a lot of time and practice. Stocks that move up over a period of time with a series of higher highs and higher lows are essentially in uptrends; stocks that move down with lower highs and lower lows over a period of time are in downtrends. Also with the help of support, resistance, trends, breakouts and reversals, a trading chart pattern could be identified.
Do chart patterns work in trading?
Yes, chart patterns do work in trading as the shapes that trading chart patterns frequently take might assist predict price movement, such as stock breakouts and reversals. Gaining a competitive edge in the market via the recognition and use of chart patterns will improve the quality of your future technical analysis. It’s crucial to become familiar with the various styles of trading charts before beginning your chart pattern research.
How accurate is the head and shoulders pattern?
The head and shoulders pattern, which reaches its forecast objective over 85% of the time, is statistically the most accurate of the price action patterns. Many price action traders use head and shoulder patterns in their trading to make profits which is why the H & S pattern is highly studied and implemented.
Who is the target market for head and shoulders?
All the price action traders who either trade intraday, or do swing trading are the target market for head and shoulders pattern. This pattern is used by different traders in different timeframes and is extremely consistent in giving profitable results.
𝗝𝗼𝗶𝗻 𝗼𝘂𝗿 𝘁𝗲𝗹𝗲𝗴𝗿𝗮𝗺 𝗰𝗵𝗮𝗻𝗻𝗲𝗹 𝘁𝗼 𝗹𝗲𝗮𝗿𝗻 𝘁𝗵𝗲 𝘀𝘁𝗼𝗰𝗸 𝗺𝗮𝗿𝗸𝗲𝘁 𝗯𝗮𝘀𝗶𝗰𝘀- 𝗙𝗶𝗻𝘄𝗶𝗻𝗴𝘀 𝗦𝘁𝗼𝗰𝗸 𝗧𝗿𝗮𝗱𝗶𝗻𝗴 𝗔𝗰𝗮𝗱𝗲𝗺𝘆~ 𝗙𝗿𝗲𝗲 𝗘𝗱𝘂𝗰𝗮𝘁𝗶𝗼𝗻𝗮𝗹 𝗖𝗵𝗮𝗻𝗻𝗲𝗹:⬇️
t.me/finwingsstocks
𝐕𝐢𝐬𝐢𝐭 𝐨𝐮𝐫 𝐰𝐞𝐛𝐬𝐢𝐭𝐞 ![]() : https://finwingsacademy.com
: https://finwingsacademy.com
𝐋𝐢𝐧𝐤𝐞𝐝𝐈𝐧: https://www.linkedin.com/company/finwings-stock-trading-academy/
𝐖𝐞𝐞𝐤𝐞𝐧𝐝 𝐚𝐧𝐝 𝐰𝐞𝐞𝐤𝐝𝐚𝐲𝐬 𝐛𝐚𝐭𝐜𝐡𝐞𝐬 𝐰𝐢𝐭𝐡 𝐚 𝐦𝐚𝐱𝐢𝐦𝐮𝐦 𝐨𝐟 𝟓 𝐫𝐞𝐠𝐢𝐬𝐭𝐫𝐚𝐭𝐢𝐨𝐧𝐬 𝐩𝐞𝐫 𝐛𝐚𝐭𝐜𝐡. 𝐂𝐚𝐥𝐥 𝐍𝐨𝐰 📲 – 09773225512
𝐓𝐰𝐢𝐭𝐭𝐞𝐫: https://lnkd.in/geScFX27